
Market Statistics Report for December 9, 2025
Market Dashboard – Dashboard Cromford Index
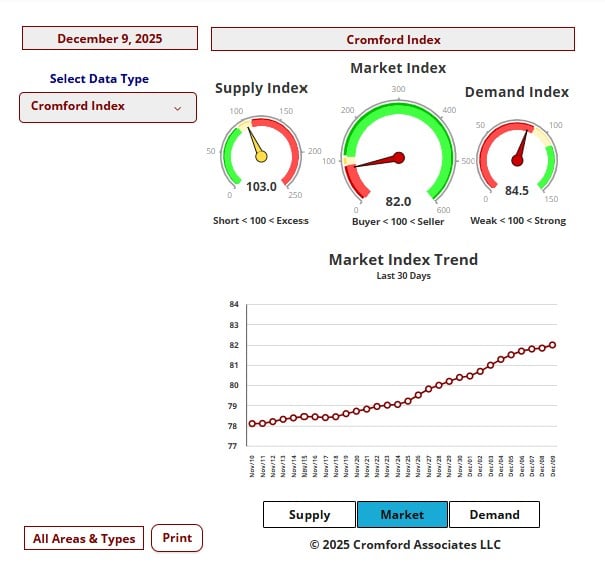
This Dashboard provides a comprehensive summary of the current state of the overall residential resale market.
All the statistics shown are for the entire Arizona Regional area as defined by ARMLS. All residential resale transactions
recorded by ARMLS are included. Geographically, this includes Maricopa County, a large part of Pinal County and a small
part of Yavapai county. In addition, "out of area" listings recorded on ARMLS are included, although these usually
constitute a very small percentage of total sales and have very little effect on the data.
All dwelling types are included. For-sale-by-owner, auctions and other non-MLS transactions are not included. Land,
commercial units, and multiple dwelling units are also excluded.
commercial units, and multiple dwelling units are also excluded.
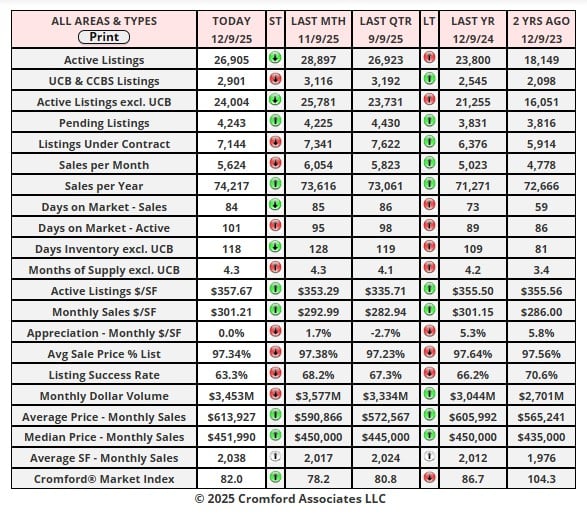
City Ranking – Snapshot
This table ranks the cities by their annual average sales price per square foot. Only single family detached homes are
included in these numbers. Information for the large and secondary cities is current as of the date shown. Data for the
11 small cities is updated on a monthly basis, and is measured on the 13th of each month.The primary function of this
table is to show the least and most affordable areas in the Phoenix metropolitan area together with longer term pricing
trends.Annual averages are based on a relatively large number of sales. Therefore they are not as subject to rapid
change as monthly averages. The downside is that they do not necessarily represent the current market very
accurately, since they include sales from up to a year ago. Pricing may have moved a great deal since then.
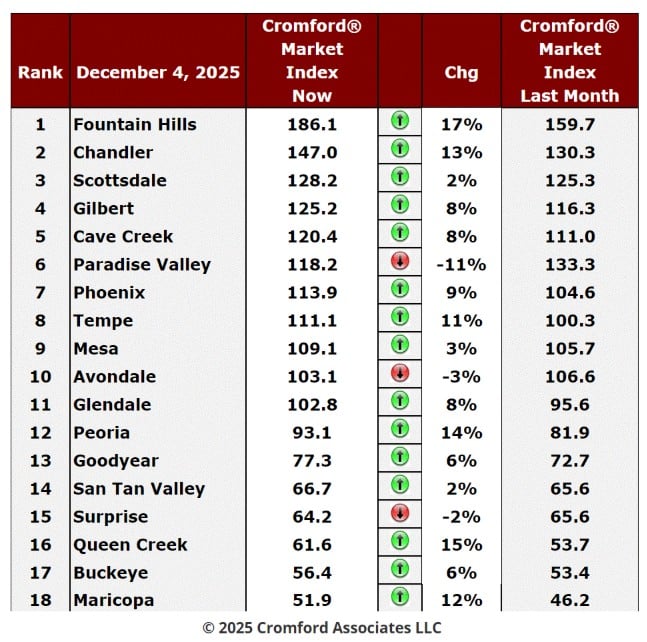
Cromford Market Index
Dec 4 - Here is our latest table of Cromford® Market Index values for the single-family markets in the 17 largest
cities.
cities.
Cromford Market Index Commentary
The trend over the last week has been strongly favorable to sellers, with demand rising noticeably and supply falling
more quickly than normal for the time of year. This has resulted in green circles outnumbering red circles by 15 to
3. Scottsdale and San Tan Valley were the two that flipped from red to green since last week. The average change
in CMI over the last month is +6.4%, up quite a bit from +3.6% last week.
Leading the charge for sellers are Fountain Hills and Chandler at the top of the table like last week, but Queen
Creek, Peoria, Maricopa and Tempe have also moved up by 10% or more. Paradise Valley is the leading city
improving for buyers with its CMI down 11% in the last month, but even this is a lot less than last week. It has also
improved for sellers if we look only at the change in its CMI over the last week. The two others in that group favoring
buyers declined by 3% or less. Like PV, Avondale turned around in the last week and Surprise is the only city still
moving in favor of buyers right now.
Once again, it is particularly encouraging to see the bottom 3 cities all moving substantially in favor of sellers.
We now have 8 cities in seller's market, 4 balanced and 6 in buyer's markets.
NOTE: Key Cromford Metrics
• Cromford Market Index (CMI): A single score that measures the balance between supply and demand in the
residential resale market.
residential resale market.
o Above 110: Seller's market
o 90–110: Balanced market
o Below 90: Buyer's market
Monthly Average Sales Price per Square Foot – Greater Phoenix
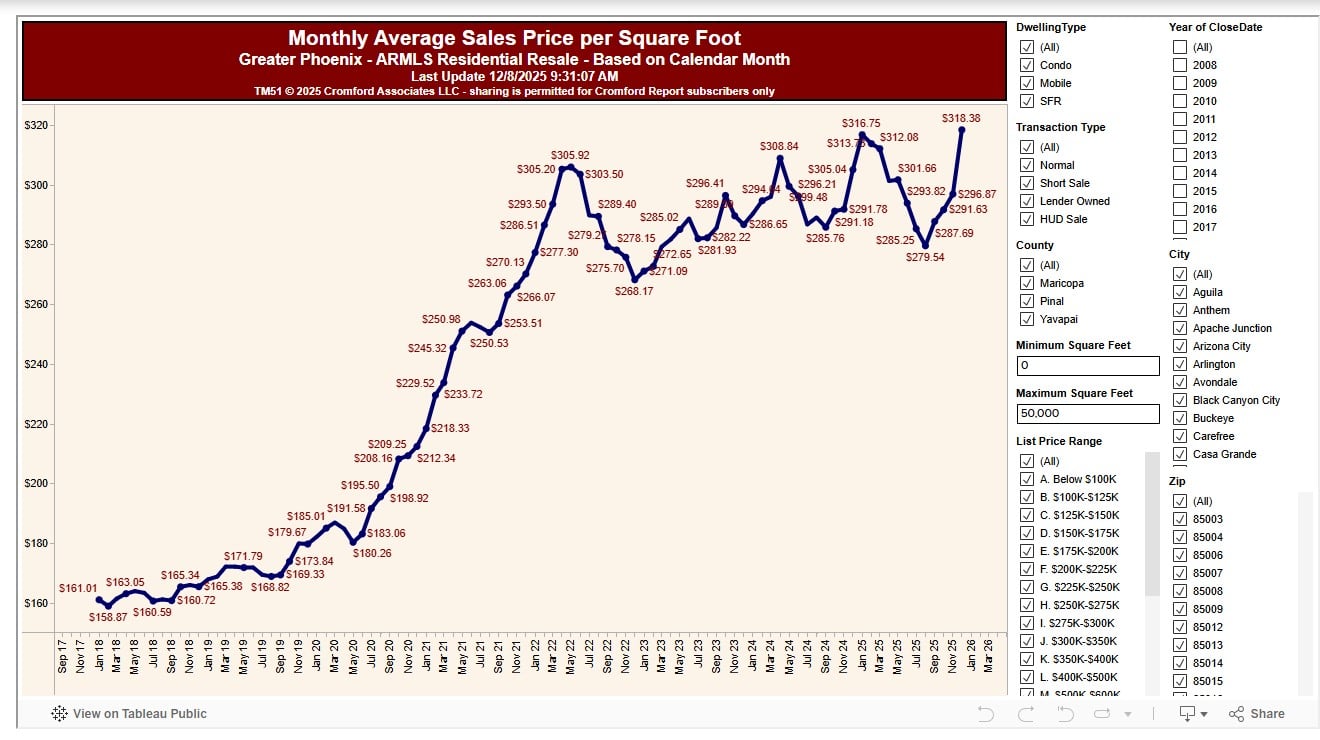
Dec 8 – There was a sharp spike in the reading for December.
Now we are seeing a record high of $318.38, up from $296.87. This is only based on a week of closings, but that
is still 1,243 transactions and so not a trivial number.
is still 1,243 transactions and so not a trivial number.
What is causing this sudden spike?
• Sales pricing is holding up much better in the fourth quarter than you might have expected having experienced
the third quarter.
the third quarter.
• The transaction mix is getting heavily skewed towards the higher price ranges
• Higher price ranges have higher price per square foot, even exceeding $1000 / sf for the uber-luxury segment,
Market Shifts by Price Range
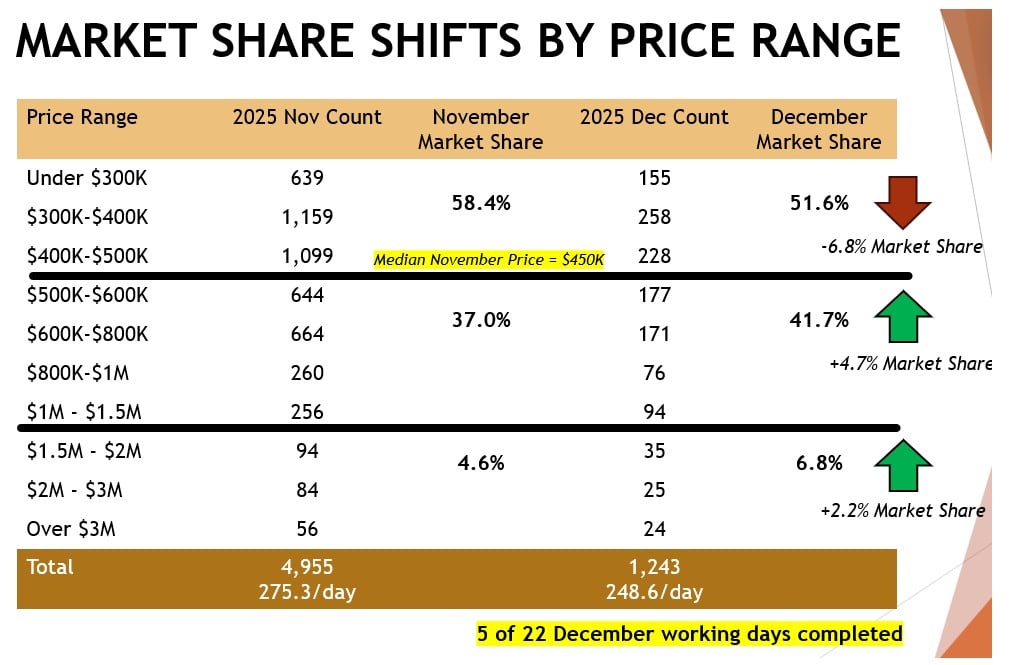
Comparing the last week with the whole of November (4,955 transactions), we see homes up to $500K selling
in far lower numbers, 128 per working day versus 161. Those between $500K and $1.5M sold in similar
numbers, 104 versus 101 per day. Those over $1.5M sold in higher numbers, 17 versus 13 per day.
in far lower numbers, 128 per working day versus 161. Those between $500K and $1.5M sold in similar
numbers, 104 versus 101 per day. Those over $1.5M sold in higher numbers, 17 versus 13 per day.
This shift away from the low-end and towards the high end contributes greatly to the average $/SF moving
higher.
higher.
If we redraw the chart with only homes priced at $500K or less it looks quite different:
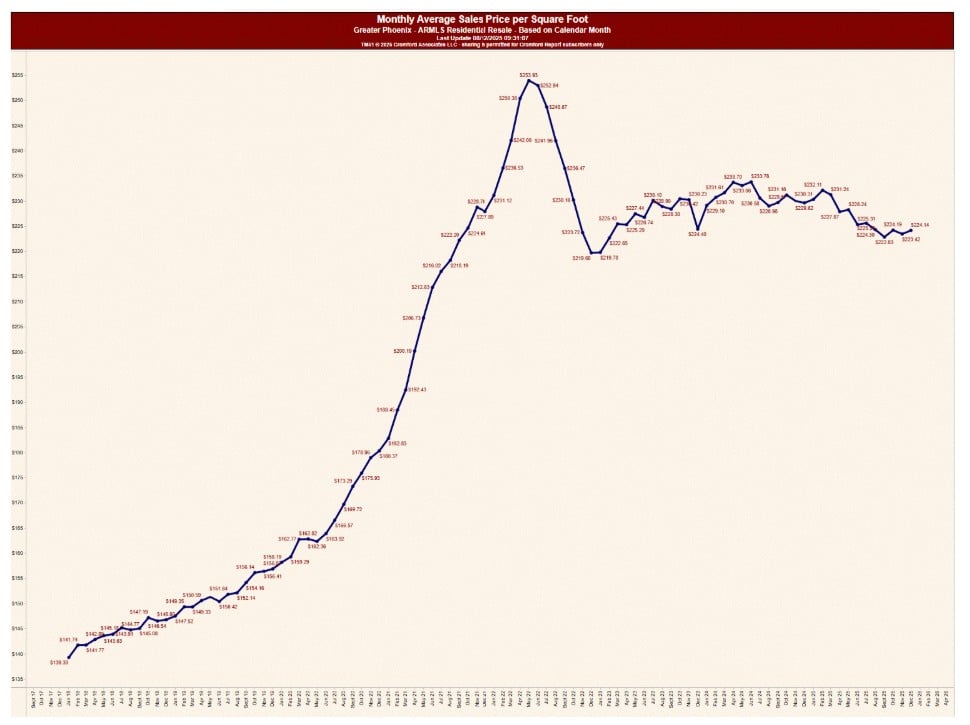
For this price sector, despite an upward drift in the last 3 months, the trend since June 2024 has been lower.
This sector represents more than half the market since the median sales price is $450,000 at the moment.
For people with a lot of money, homes that cost a lot of money are still expensive. For people with not so
much money, but enough to buy a home, entry-level homes are getting more affordable, especially when
household incomes are rising and home prices are mostly lower over the past year or two.
much money, but enough to buy a home, entry-level homes are getting more affordable, especially when
household incomes are rising and home prices are mostly lower over the past year or two.
It is less difficult to afford a modest home than it was two years ago. Affordability is improving, not getting
worse. This could be the key reason we are seeing improving demand.
worse. This could be the key reason we are seeing improving demand.
For the first week of December, the average $/SF for the 3 segments were:
• $224.14 for homes at $500K or less
• $307.87 for homes between $500K and $1.5M
• $642.86 for homes over $1.5M
• $224.14 for homes at $500K or less
• $307.87 for homes between $500K and $1.5M
• $642.86 for homes over $1.5M
We would normally expect these distorting effects to reduce as December draws to a close. In most years,
and indeed most months, a lot of lower priced transactions tend to close in the last few days of each month.
and indeed most months, a lot of lower priced transactions tend to close in the last few days of each month.