
Market Statistics Report for January 21, 2026
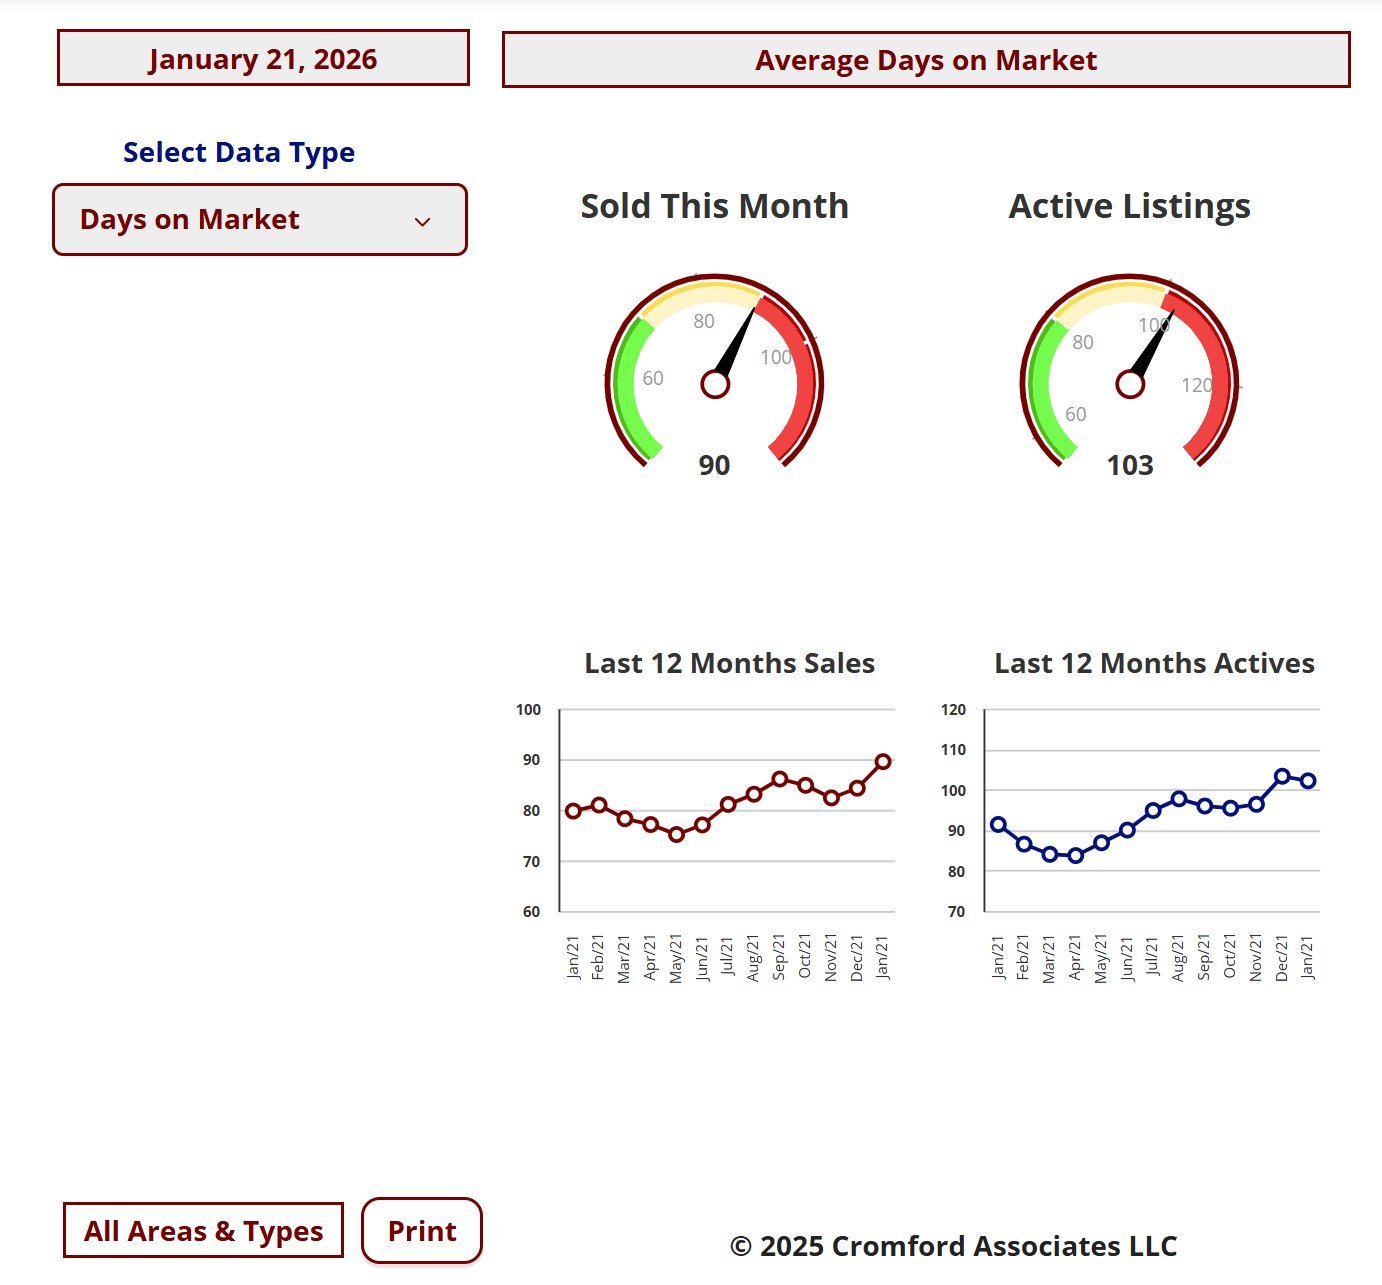
Market Dashboard – Days On Market Average
This Dashboard provides a comprehensive summary of the current state of the overall residential resale market.
All the statistics shown are for the entire Arizona Regional area as defined by ARMLS. All residential resale transactions
recorded by ARMLS are included. Geographically, this includes Maricopa County, a large part of Pinal County and a small
part of Yavapai county. In addition, "out of area" listings recorded on ARMLS are included, although these usually
constitute a very small percentage of total sales and have very little effect on the data.
All dwelling types are included. For-sale-by-owner, auctions and other non-MLS transactions are not included. Land,
commercial units, and multiple dwelling units are also excluded.
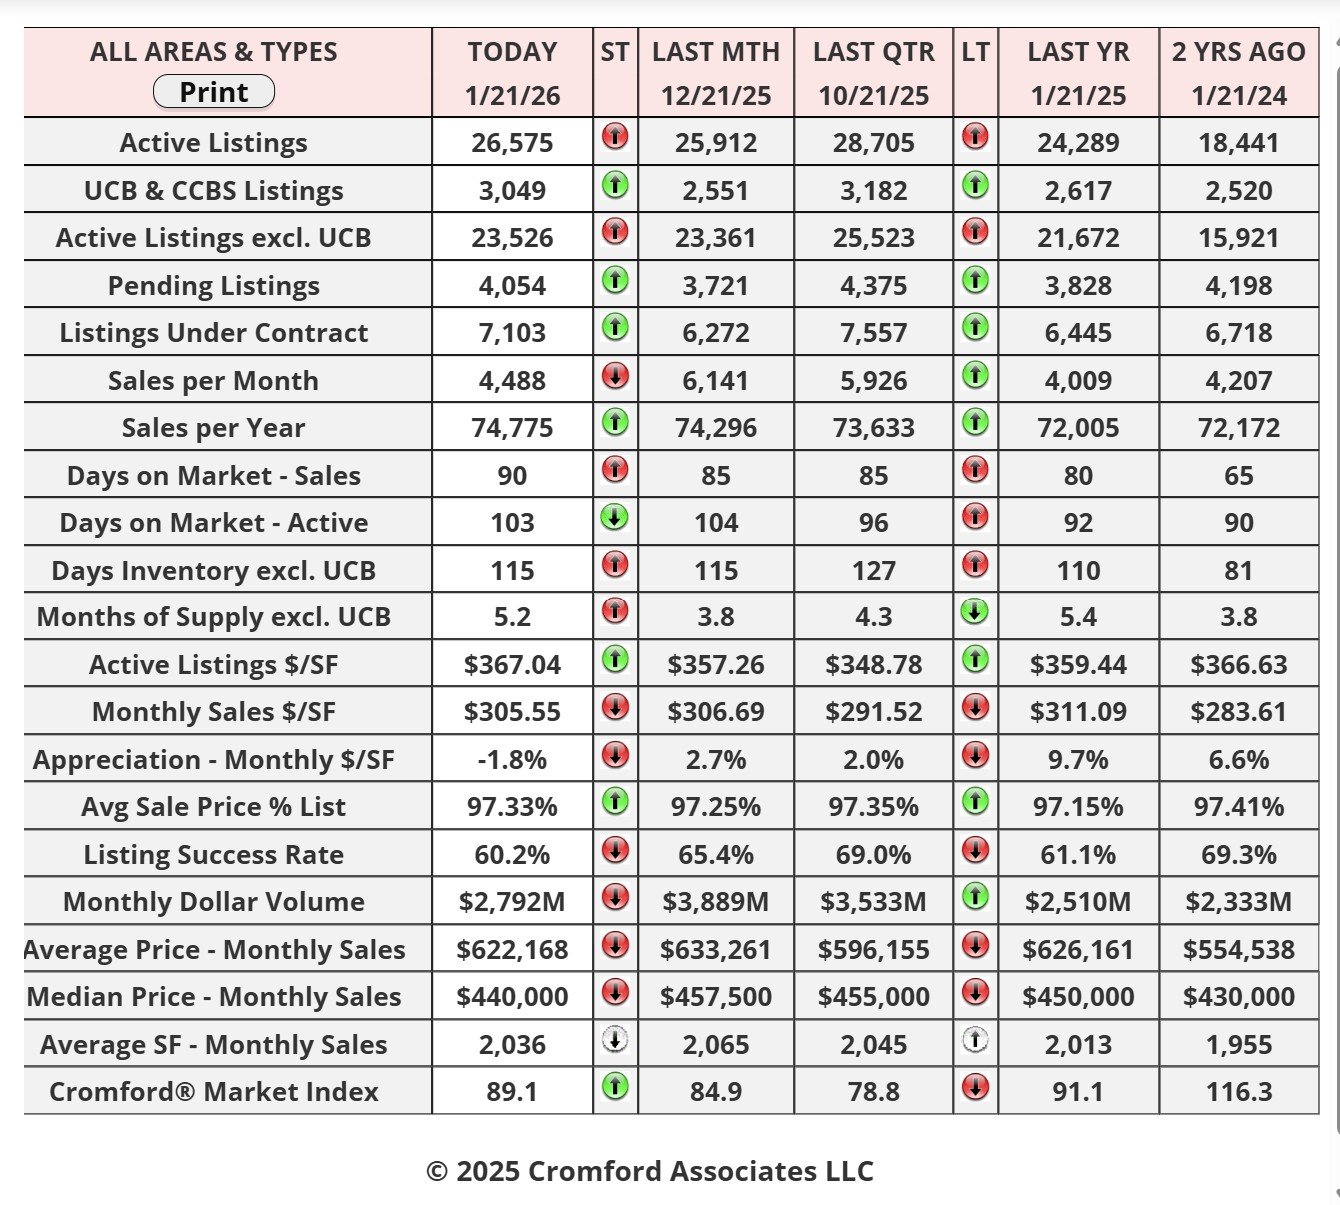
City Ranking – Snapshot
This table ranks the cities by their annual average sales price per square foot. Only single family detached homes are
included in these numbers. Information for the large and secondary cities is current as of the date shown. Data for the
11 small cities is updated on a monthly basis, and is measured on the 13th of each month.The primary function of this
table is to show the least and most affordable areas in the Phoenix metropolitan area together with longer term pricing
trends.Annual averages are based on a relatively large number of sales. Therefore they are not as subject to rapid
change as monthly averages. The downside is that they do not necessarily represent the current market very
accurately, since they include sales from up to a year ago. Pricing may have moved a great deal since then.
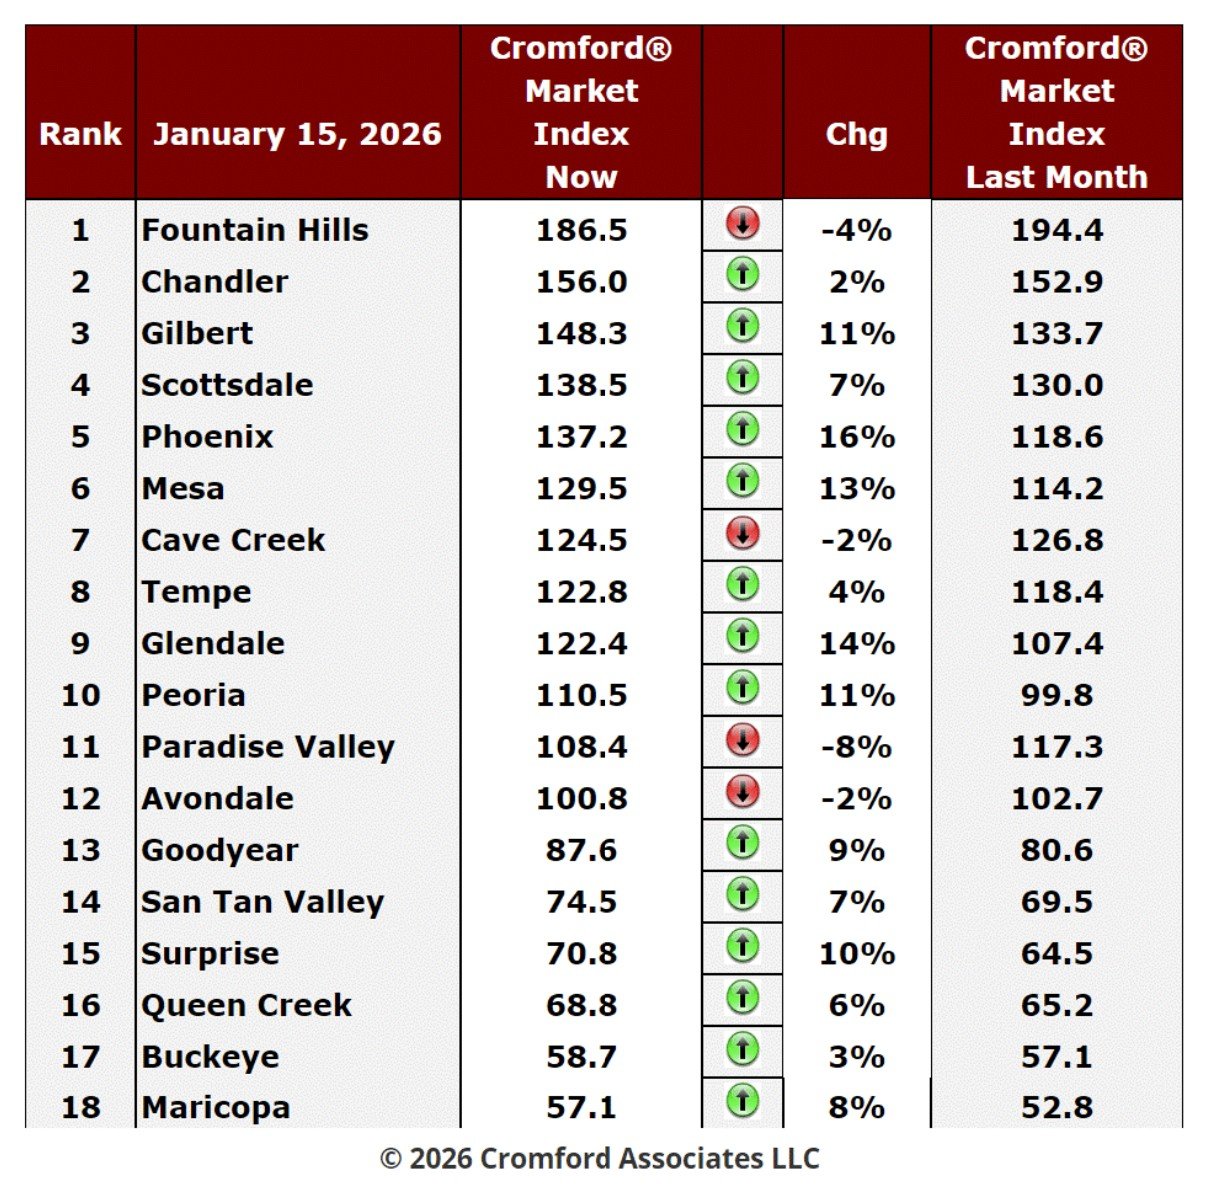
Cromford Market Index
Jan - Here is our latest table of Cromford® Market Index values for the single-family markets in the 18 largest cities.
Cromford Market Index Commentary
The number of cities moving in a direction favorable to buyers has doubled since last week. Fountain Hills and
Cave Creek have joined Avondale and Paradise Valley leaving 14 cities moving in favor of sellers. Sellers can take
some comfort in the fact that all 4 cities moving in favor of buyers are relatively small.
Cave Creek have joined Avondale and Paradise Valley leaving 14 cities moving in favor of sellers. Sellers can take
some comfort in the fact that all 4 cities moving in favor of buyers are relatively small.
The average CMI is currently up 5.8% over the last month, which is not as positive as the 8.1% we saw last week.
The trend in favor of sellers has weakened a little over the past 21 days and although still intact it is looking a bit
wobbly.
The trend in favor of sellers has weakened a little over the past 21 days and although still intact it is looking a bit
wobbly.
The biggest moves in favor of sellers have been seen in Phoenix, Glendale, Mesa, Gilbert, Peoria, and Surprise.
We have 10 cities in a seller's market, 2 balanced and 6 in a buyer's market. This is unchanged from last week.
However, Peoria moved up from balanced to a seller's market while Paradise Valley did the opposite.
NOTE: Key Cromford Metrics
• Cromford Market Index (CMI): A single score that measures the balance between supply and demand in the
residential resale market.
o Above 110: Seller's market
o 90–110: Balanced market
o Below 90: Buyer's market
residential resale market.
o Above 110: Seller's market
o 90–110: Balanced market
o Below 90: Buyer's market
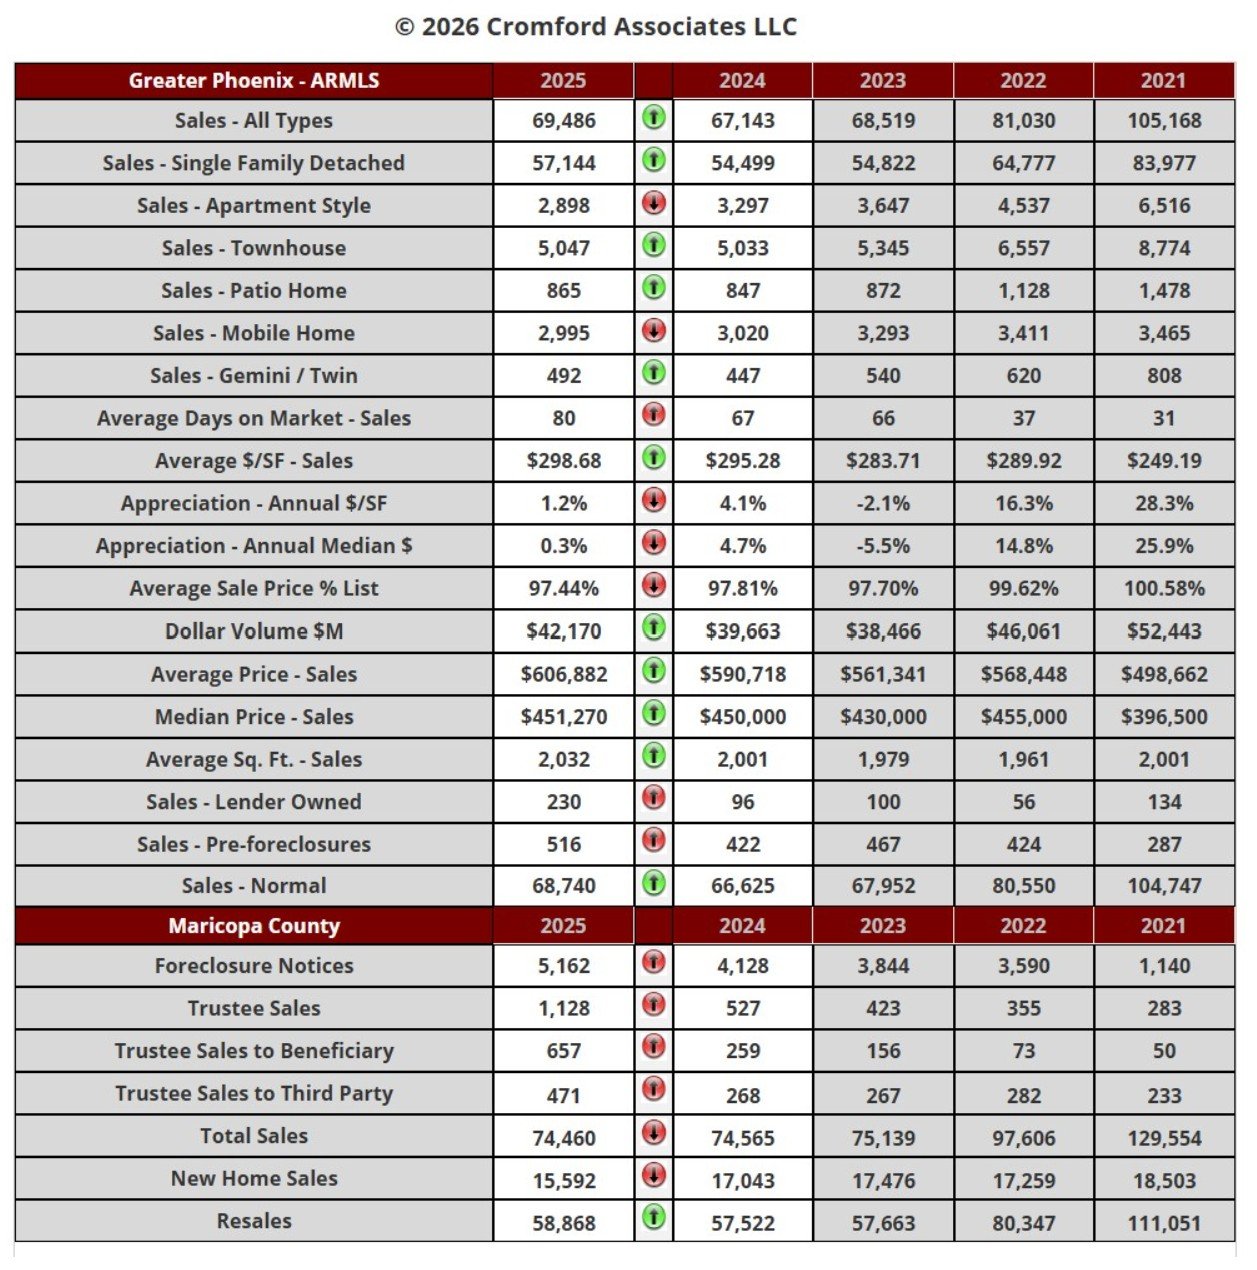
Jan 16 - The annual snapshot was published a few days ago and illustrates a few interesting trends. 2025 was
unlike 2024 in several ways:
unlike 2024 in several ways:
First, we note that apartment-style homes sold in lower volumes. A drop of 12% compared with the year before,
whereas single-family detached homes sold 5% more. This is an unusually strong swing away from a specific
dwelling type.
whereas single-family detached homes sold 5% more. This is an unusually strong swing away from a specific
dwelling type.
Secondly, there has been a major rise in completed foreclosures, almost doubling compared with the year before.
Those of an alarmist persuasion could focus on this fact, but the volumes are still tiny and not even back to what
we would consider normal yet. They are heading in that direction though.
we would consider normal yet. They are heading in that direction though.
Thirdly, we see a swing in favor of re-sales and away from new homes. New homes went down 9% while re-sales
rose 2%.
rose 2%.
The Affidavits of Value – Monthly
Jan 9 – Below are the affidavits of value analyzed for Maricopa County's December filings:
There were 6,098 closed transactions, up 5.0% from 5,805 in December 2024 but up 16.8% from November.
There were 1,205 closed new homes, down 13.2% from 1,388 in December 2024 but up 11.1% from November.
There were 4,893 closed re-sale transactions, up 10.8% from 4,417 in December 2024 and up 18.3% from
November.
November.
The overall median sales price was $489,652, up 1.4% from December 2024 and up 2.0% from November.
The new home median sales price was $539,087, up 1.1% from December 2024 and up 1.8% from November.
The re-sale median sales price was $470,000, up 2.6% from December 2024 and up 2.2% from November.
December 2025 had 22 working days giving it a 5% advantage over December 2024, which had 21 working days.
November 2025 only had 18 working days, so month to month December 2025 had a massive 22% advantage over
the prior month.
November 2025 only had 18 working days, so month to month December 2025 had a massive 22% advantage over
the prior month.
In this light the 5% growth in closings year over year is essentially flat and the 17% increase over November is below
par. The problems are mainly occurring in new homes rather than re-sales. New home closings were down 13.2%
compared to a year earlier, which is really 21% when we allow for the change in working days per month. This follows
weak sales in new homes in November and confirms that the recent era of new homes outperforming re-sales is
now well over.
If we look exclusively at resales, then the closing count in December was almost 6% better than a year earlier
(adjusted for the working day count) though still slightly below November on a sales per day basis.
(adjusted for the working day count) though still slightly below November on a sales per day basis.
Median prices were a little higher than a year ago, but by less than the rate of inflation, consistent with being in a
buyer's market for almost all of the past year. Relative to re-sales, new home pricing was weaker in December, and
we must remember that the median price using the top-line sale price, ignoring all below-the-line concessions, which
have been particularly large in the last few years are builders pay to lower their buyer's mortgage rates. They tend
to be more aggressive with this type of incentive than resellers.
Overall, we can conclude that the resale market is doing OK under the current circumstances, but the new home
market in Maricopa County has cooled a lot in the last few months.
market in Maricopa County has cooled a lot in the last few months.
**All these numbers include single-family and townhouse/condo properties in Maricopa County only.