
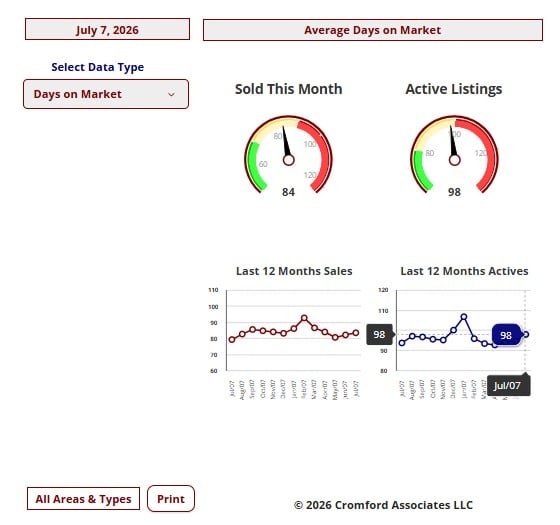
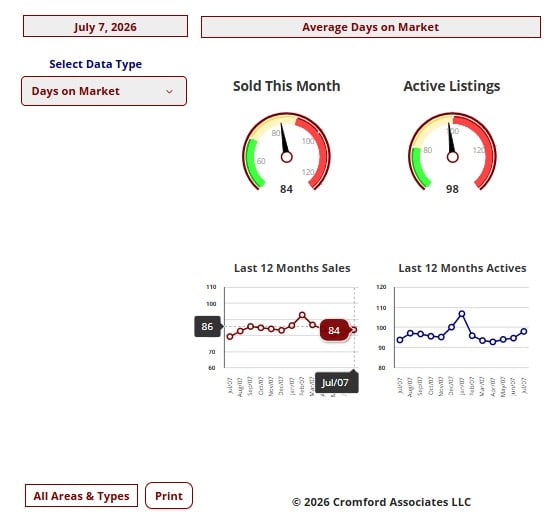
Market Statistics Report for July 7, 2026Market Dashboard – Days On MarketThis Dashboard provides a comprehensive summary of the current state of the overall residential resale market.All the statistics shown are for the entire Arizona Regional area as defined by ARMLS.All residential resale transactions recorded by ARMLS are included. Geographically, this includes Maricopa County, a large part of Pinal County and a small part of Yavapai county. In addition, "out of area" listings recorded on ARMLS are included, although these usually constitute a very small percentage of total sales and have very little effect on the data. All dwelling types are included. For-sale-by-owner, auctions and other non-MLS transactions are not included. Land, commercial units, and multiple dwelling units are also excluded.
Cromford Market Index Commentary
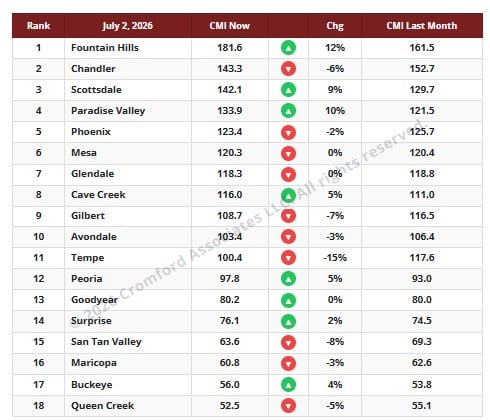
The average CMI is unchanged over the last month. While individual cities have risen or fallen, there is very little interest, as the average change is 0.0%. In general, supply has fallen, but a similar drop in demand has offset this. In the more expensive areas, supply has dropped significantly as listings expire for the summer months. These areas look better for sellers because they have less competition, not because there are more buyers.
For sellers, it is a little worse than last week, when we saw a 1% increase in the average CMI, the same percentage that we measured the week before. I guess that is good news for buyers, but only just.
The number of cities moving in a direction favorable to buyers is ten, three more than last week.
We have eight moving in a direction that is favorable to sellers. Once again, Fountain Hills and Paradise Valley have improved substantially for sellers, while Scottsdale is up by 9%. In the other direction, Tempe is still showing big moves in favor of buyers. The Southeast Valley, in general, looks less good for sellers and better for buyers; the best city for sellers is Mesa, with a slight change from 120.4 to 120.3. We now have 8 cities in a seller’s market, 4 balanced, and 6 in a buyer’s market.
NOTE: Key Cromford Metrics
• Cromford Market Index (CMI): A single score that measures the balance between supply and demand in the residential resale market.
o Above 110: Seller's market
o 90–110: Balanced market
o Below 90: Buyer's market
Market Summary for the Beginning of July 2026
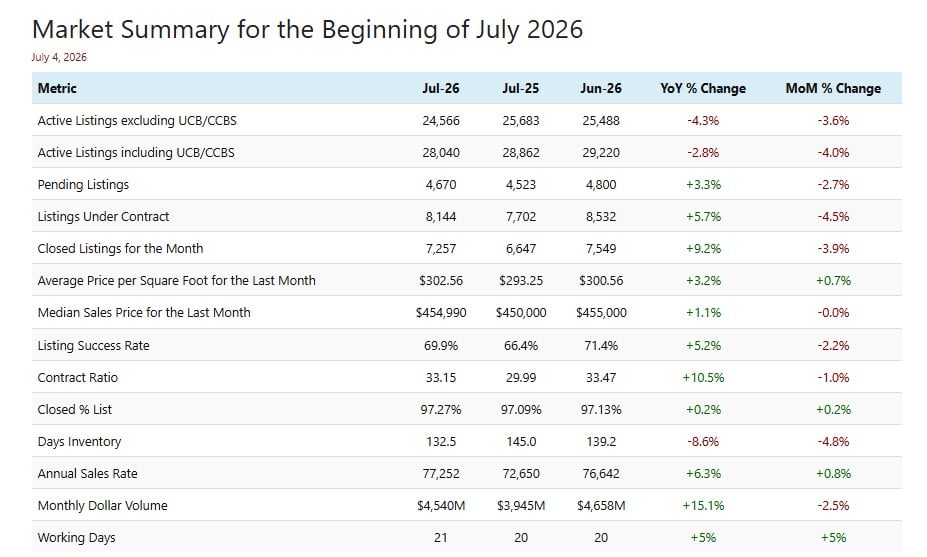
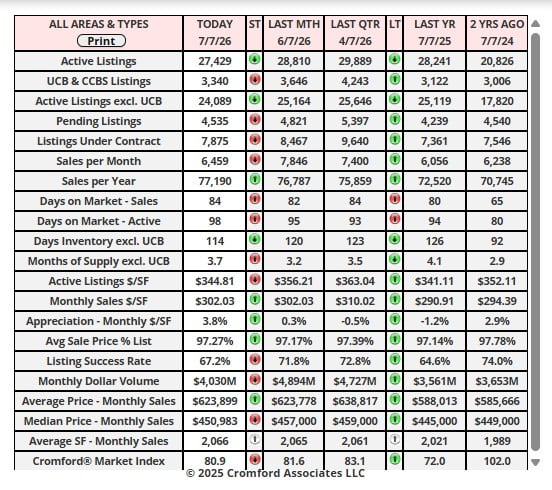
The market situation in early July is clearly better than it was in July 2025 across all the above metrics, but is more mixed when comparing with last month (June). On the positive side, we have a slightly higher % of list achieved than a month ago, and inventory and supply measures are lower (a good thing for sellers). The annual sales rate also continues its slow recovery, and pricing looks slightly stronger when measured by average $/SF, though it flatlines when measured by the median sales price.
Supply is dropping slowly, and we now have fewer active listings than last month and this time last year. This helps sellers because they have less competition. Supply has dropped by a larger percentage at higher price points, as some luxury home sellers don’t show their homes during the hottest months of the year and wait until late September to relist.
Demand has fallen since last month, in line with normal seasonal patterns, but it remains better than at this time last year. Closed listings are up more than 9% year-over-year, but we can attribute 5% of that to June 2026 having an extra working day. Still a good result though under difficult circumstances.
Overall, the market is well-behaved and stable, in better shape than last year but still unexciting compared with what most market participants would like to see. There is no sign of significant price declines in nominal dollars, though inflation returning to over 4% means that, in real terms, homes have become significantly more affordable over the last several years.
Maricopa County Monthly Home Sales Statistics June 2026
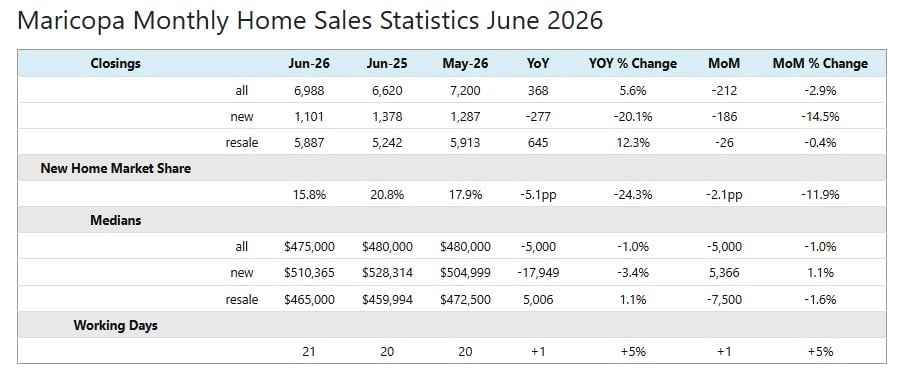
June 2026 had 21 working days, one more than June 2025 and May 2026. This means it would be fair to expect 5% more closings than for both the month-over-month and year-over-year comparisons. The resale closings far exceeded that target, up 12.3% year-over-year, but new home sales were very weak, down more than 20%. The combined result was +5.6%, just squeaking past the target and a cause for relief and mild celebration. The monthover-month closings were not so impressive, with all metrics down despite June’s 5% advantage over May.
New home sales have once again underwhelmed and not by a small margin. Having favored new homes in 2024 and 2025, buyers have been shifting strongly toward re-sales in 2026.
The overall median sales price is slightly down from last year and last month, by only 1%, so we can regard this as flat in nominal terms. However, when we account for inflation, homes have become significantly more affordable relative to median earnings. Once again, new homes are under-performing in this respect, down 3.4% year-overyear while re-sales managed a small 1.1% increase.
New homes accounted for 15.8% of the Maricopa County market in June, down from 20.8% this time last year. That is a 5.1