
Market Statistics Report for August 27, 2025
Market Dashboard – Dashboard Cromford Index
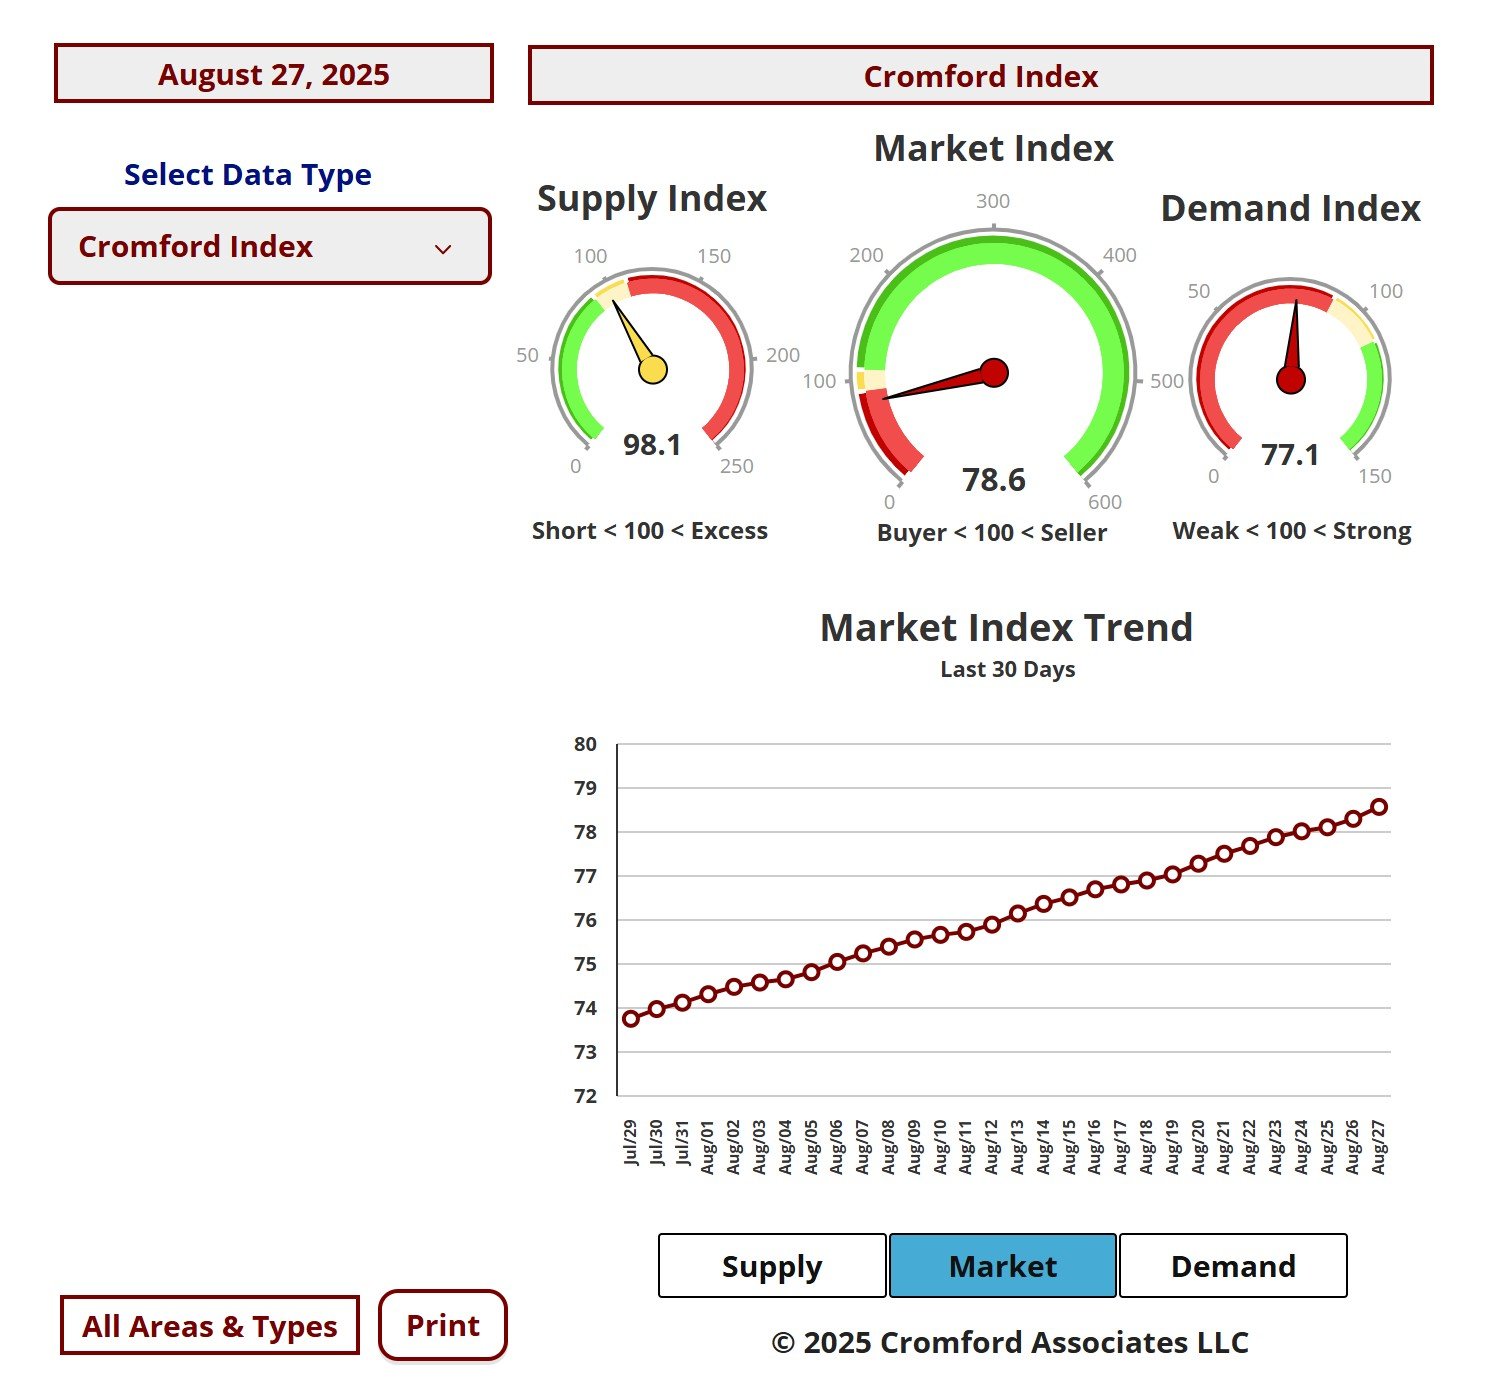
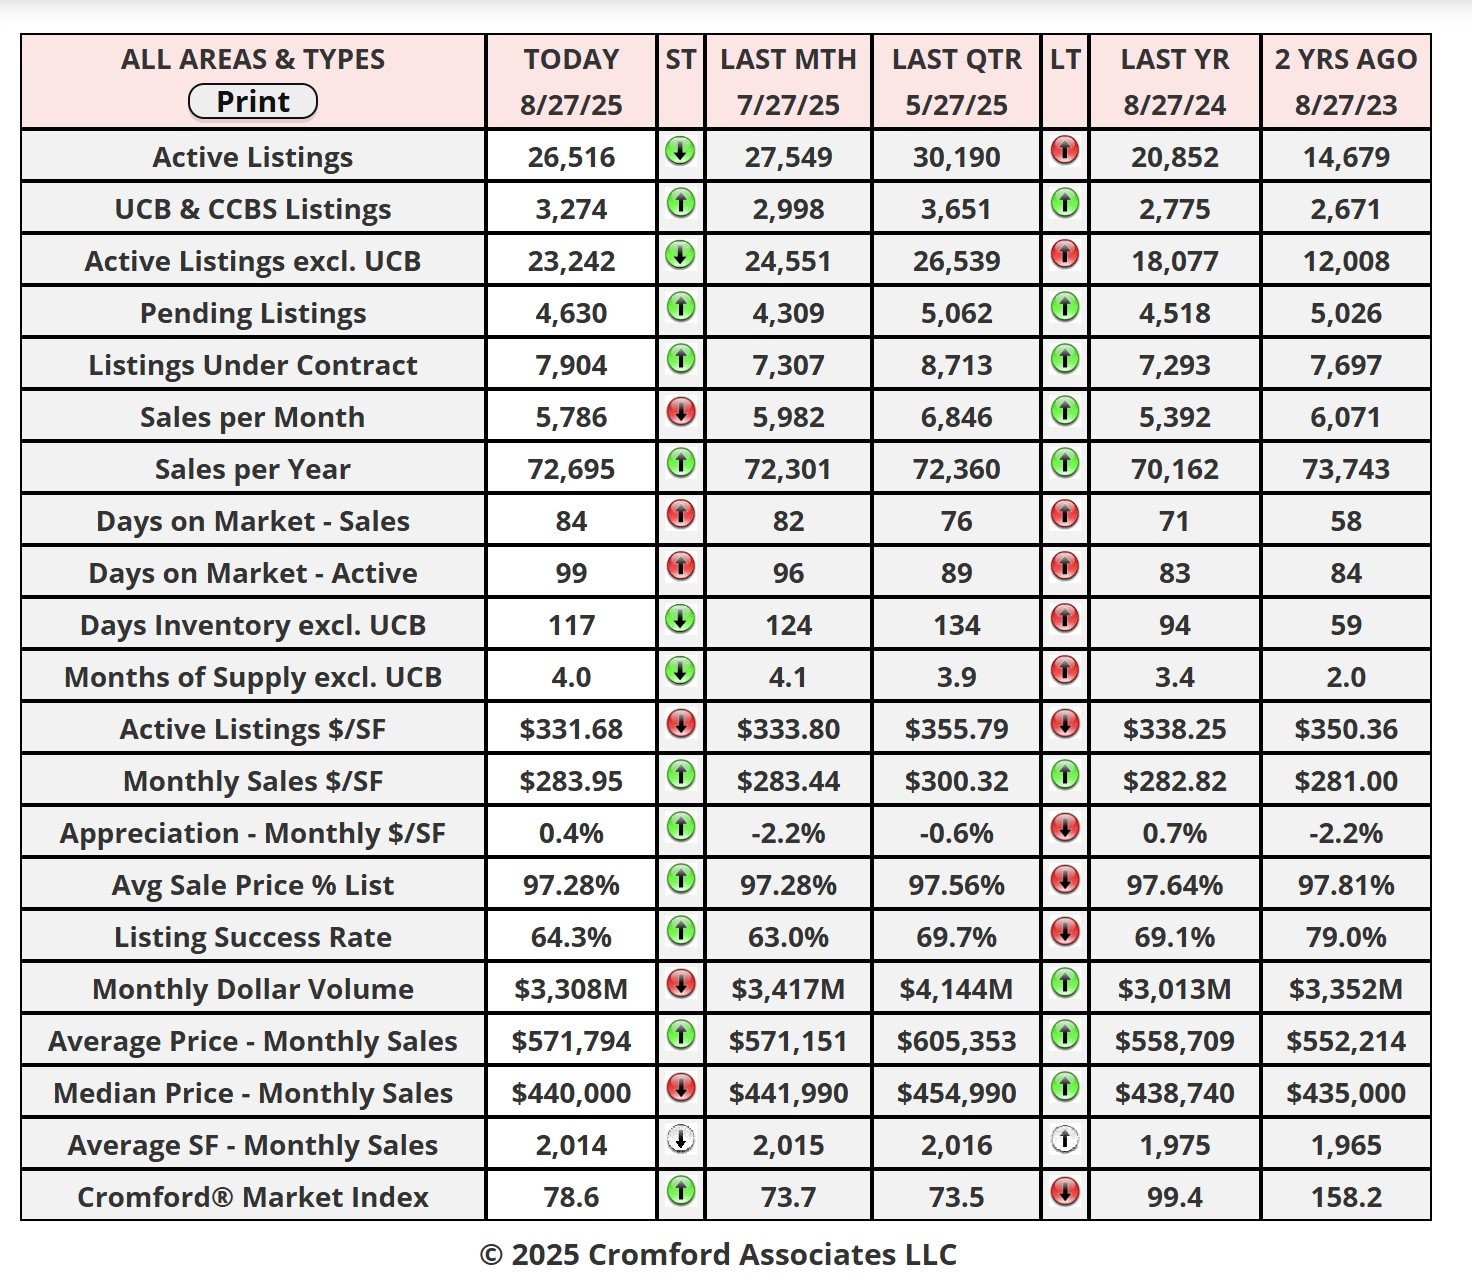
This Dashboard provides a comprehensive summary of the current state of the overall residential resale market.
All the statistics shown are for the entire Arizona Regional area as defined by ARMLS. All residential resale transactions
recorded by ARMLS are included. Geographically, this includes Maricopa County, a large part of Pinal County and a small
part of Yavapai county. In addition, "out of area" listings recorded on ARMLS are included, although these usually
constitute a very small percentage of total sales and have very little effect on the data.
All dwelling types are included. For-sale-by-owner, auctions and other non-MLS transactions are not included. Land,
commercial units, and multiple dwelling units are also excluded.
City Ranking – Snapshot
This table ranks the cities by their annual average sales price per square foot. Only single family detached homes are
included in these numbers. Information for the large and secondary cities is current as of the date shown. Data for the
11 small cities is updated on a monthly basis, and is measured on the 13th of each month.The primary function of this
table is to show the least and most affordable areas in the Phoenix metropolitan area together with longer term pricing
trends.Annual averages are based on a relatively large number of sales. Therefore they are not as subject to rapid
change as monthly averages. The downside is that they do not necessarily represent the current market very
accurately, since they include sales from up to a year ago. Pricing may have moved a great deal since then.
Cromford Market Index
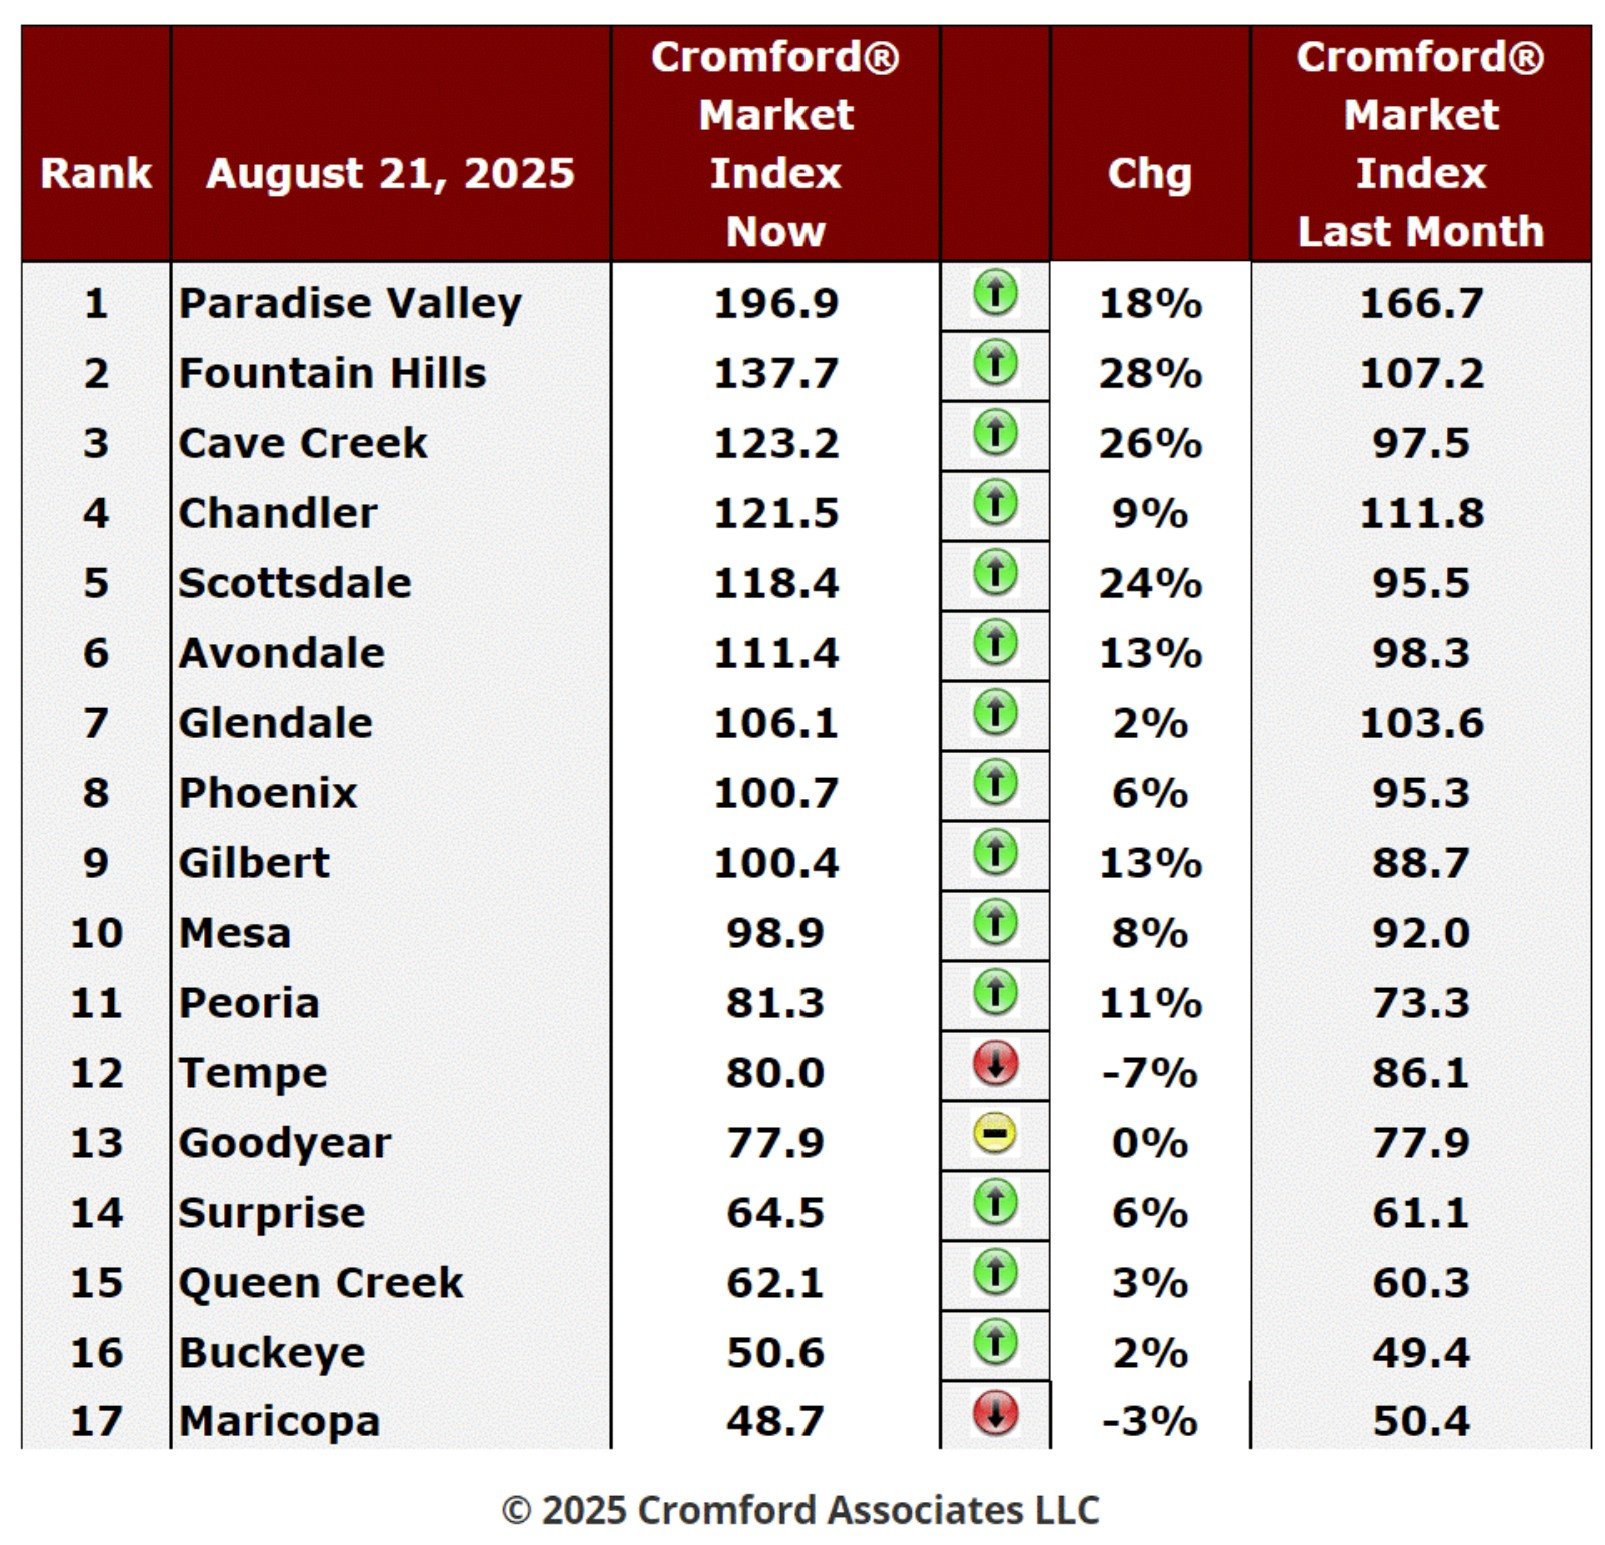
Aug 27 - Here is our latest table of Cromford® Market Index values for the single-family markets in the 17 largest
cities.
Aug 27 - Here is our latest table of Cromford® Market Index values for the single-family markets in the 17 largest
cities.
Cromford Market Index Commentary
The trend which started 5 weeks ago is still accelerating as supply continues to fall and demand gently rises. The
average monthly change in CMI is 9.3%, which is another improvement over 8.4% last week.
14 cities improved for sellers with only 2 improving for buyers (Maricopa and Tempe) and one standing still.
Fountain Hills, Cave Creek and Scottsdale have overtaken Paradise Valley in percentage rises but are still a long
way behind. It is painfully obvious that the high-end markets are stronger for buyers while many of the low to midrange markets are still favorable to buyers. Avondale, Peoria and Gilbert are all up over 10%.
We have 6 cities that are seller's markets (2 fairly weak), 4 that are balanced and 7 that are buyer markets.
Listings Under Contract Compared Weekly – Verbiage (Mortgage Rate)
Aug 25 - The typical 30-year fixed mortgage rate is down to 6.52%. This is not exactly low, but it is definitely
better for buyers than 7% or higher, which is where they were at the start of the year.
In the context of long-term interest rates, it could definitely be considered better than normal. The long-term median
since 1971 is 7.3%. For the years 1971 to mid-1993 the typical 30-year fixed mortgage rate was never below 7%,
so those grumbling about how unfavorable the housing market is today should remember that it was not exactly
easy for their parents and grandparents either. Between 1974 and 1991 rates were rarely below 9% and often over
10%.
In theory this lower rate of 6.52% should ignite some extra demand, so can we detect this in the numbers?
Well yes. The Cromford® Demand Index saw its low point on August 4 at 75.8 and has started to creep higher. We
are currently at 76.8. This is still some 23% below a normal level of demand, but the trend is favorable and over
the last week it has started to accelerate.
When this is coupled to declining inventory (thanks to so many sellers taking their homes off the market in recent
months), then the result is a more favorable situation for the sellers that remain.
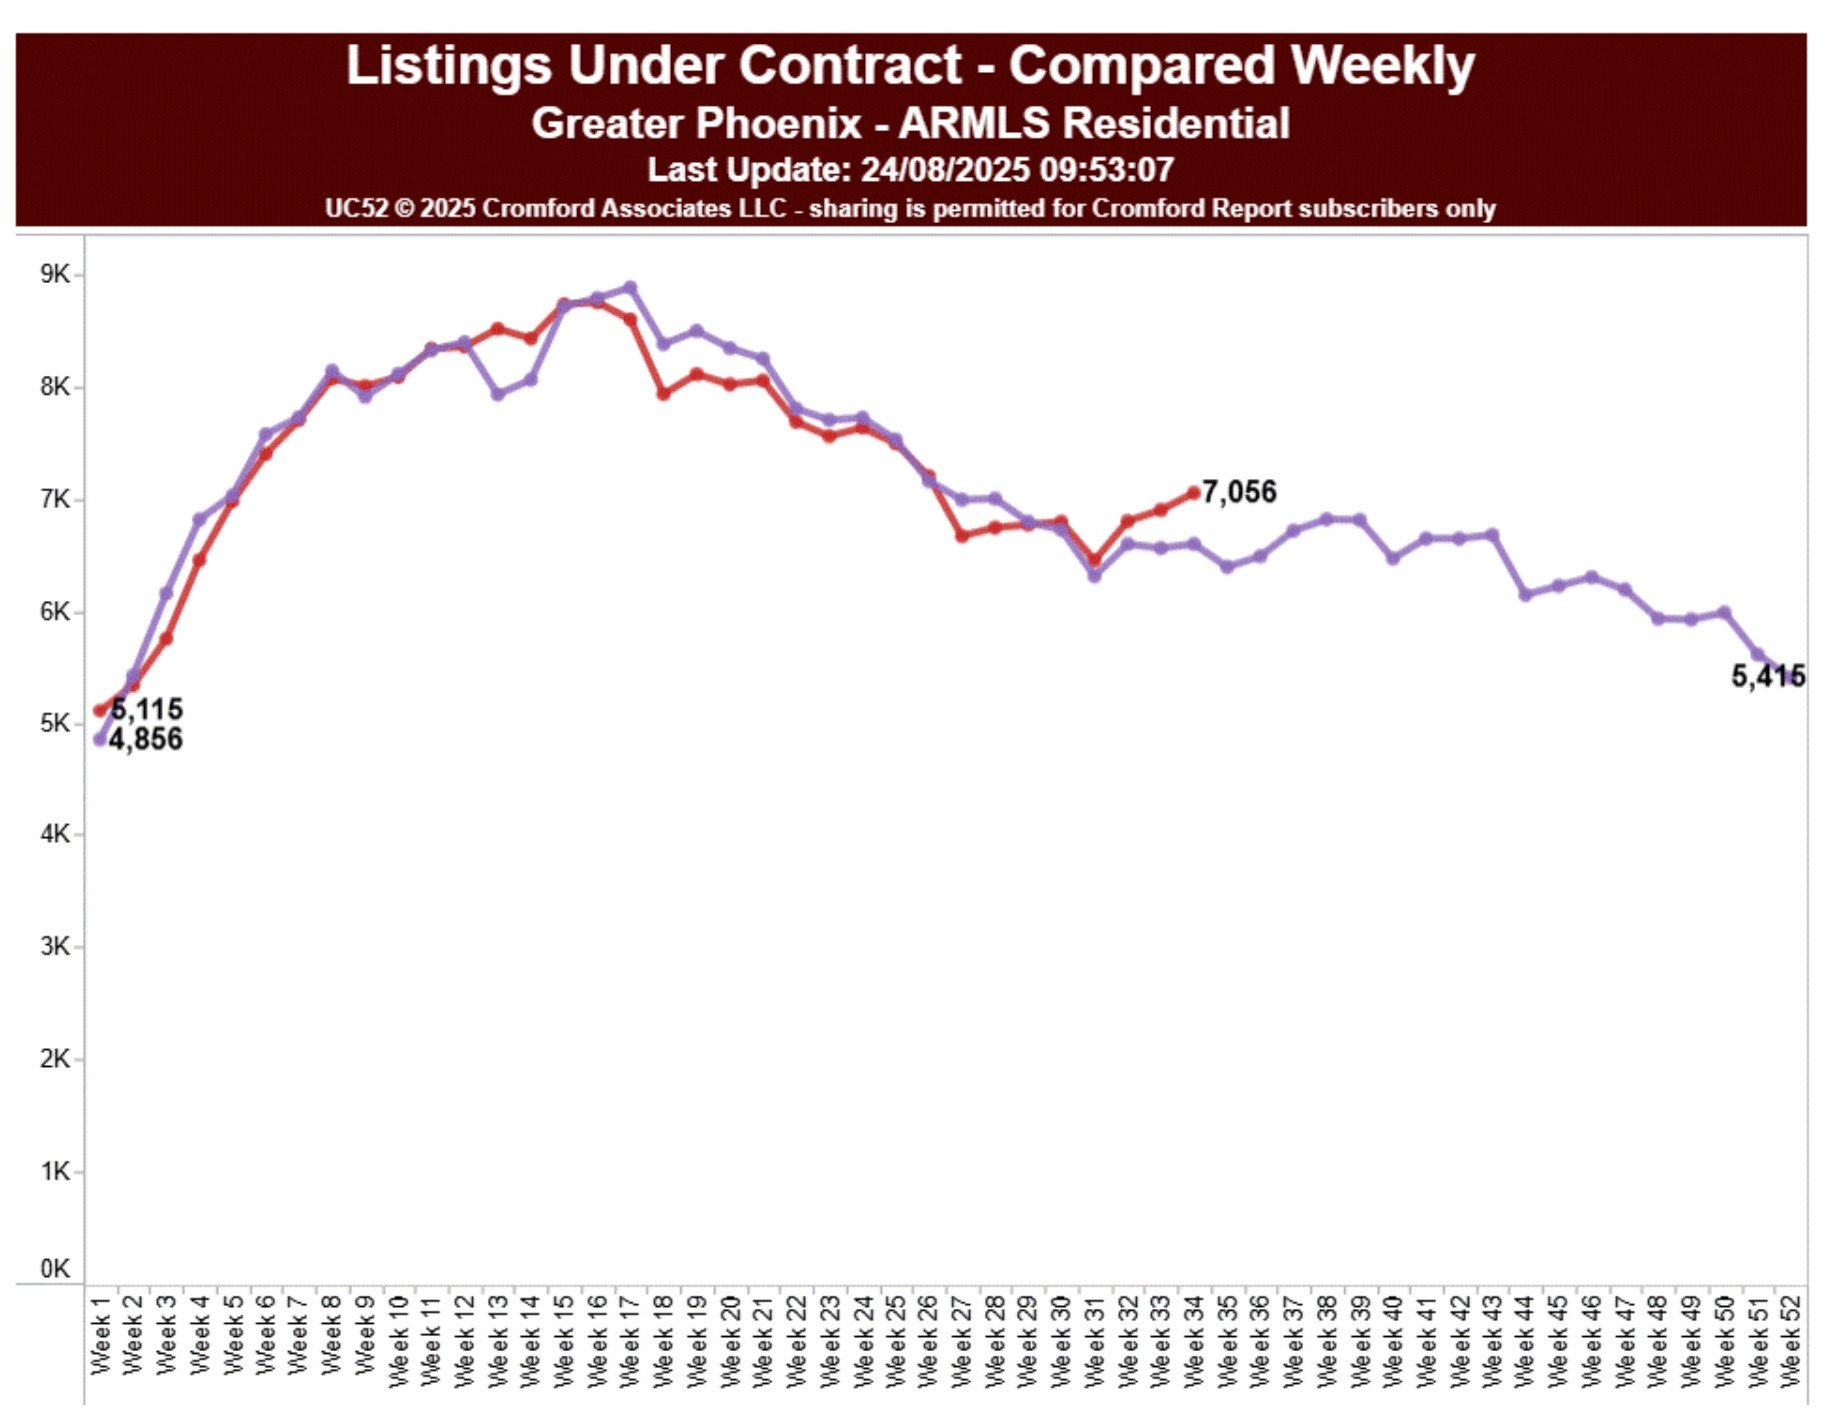
Another indicator of the improvement in demand is the number of listings under contract as shown above
and noted below:
7 weeks ago, we were below 2024 levels but now we are up by 6.9%. This is almost enough to get us back
to the 2023 line, but not quite.
The gap between 2024 and 2025 is favorable and widening.
Aug 26 - The latest S&P / Case-Shiller® Home Price Index®
The new report covers home sales during the period April to June 2025. This means the typical home sale closed
in mid-May, more than 3 months ago. Please remember that Case-Shiller data is old, even on the day it is
released.
9 cities show rising prices with 11 cities moving down over the month. The cities with rising prices are
concentrated in the North and Northeast. The South and West are experiencing price weakness across almost
the entire area.
Compared with the previous month's series we see the following changes:
1. Chicago +1.03%
2. Minneapolis +0.67%
3. Detroit +0.58%
4. Charlotte +0.47%
5. Cleveland +0.39%
6. New York +0.37%
7. Boston +0.31%
8. Tampa +0.29%
9. Dallas +0.05%
10. Atlanta -0.01%
11. Las Vegas -0.03%
12. Portland -0.16%
13. Miami -0.19%
14. San Diego -0.31%
15. Denver -0.31%
16. Seattle -0.35%
17. Los Angeles -0.43%
18. Washington -0.52%
19. Phoenix -0.55%
20. San Francisco -1.05%
Phoenix has dropped from 16th to 19th place over the last month. The national average rose +0.05% so Phoenix
was again weaker than this average.
Comparing year over year, we see the following changes:
1. New York +7.03%
2. Chicago +6.09%
3. Cleveland +4.47%
4. Detroit +4.32%
5. Boston +4.25%
6. Charlotte +2.55%
7. Minneapolis +2.51%
8. Las Vegas +2.41%
9. Washington +2.17%
10. Portland +1.01%
11. Atlanta +0.94%
12. Seattle +0.90%
13. Los Angeles +0.08%
14. Phoenix -0.06%
15. Miami -0.25%
16. Denver -0.55%
17. San Diego -0.61%
18. Dallas -0.95%
19. San Francisco -1.98%
20. Tampa -2.38%
Phoenix stayed at 14th place yet again. We now see 7 cities in negative territory - with Phoenix, Miami,
Denver and San Diego joining San Francisco, Dallas and Tampa.
The national average is +1.89% year over year. Phoenix has under-performed over the last year against
that yardstick.