
Market Statistics Report for June 6, 2026
Market Dashboard – Cromford Index
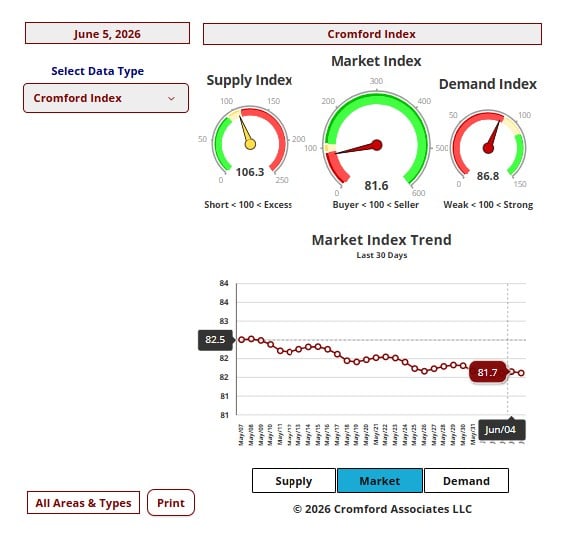
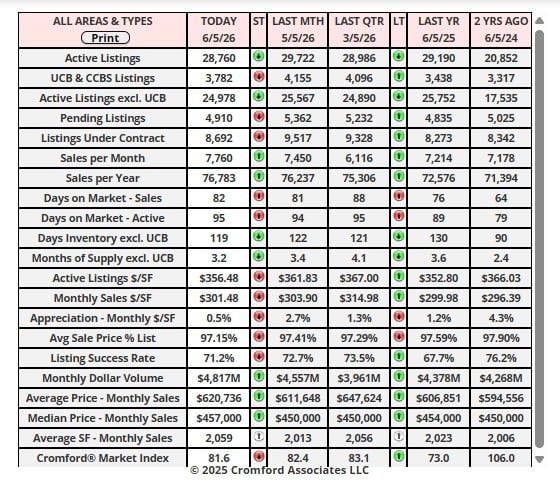
This Dashboard provides a comprehensive summary of the current state of the overall residential resale market.
All the statistics shown are for the entire Arizona Regional area as defined by ARMLS. All residential resale transactions
recorded by ARMLS are included. Geographically, this includes Maricopa County, a large part of Pinal County and a small
part of Yavapai county. In addition, "out of area" listings recorded on ARMLS are included, although these usually
constitute a very small percentage of total sales and have very little effect on the data.
All dwelling types are included. For-sale-by-owner, auctions and other non-MLS transactions are not included. Land,
commercial units, and multiple dwelling units are also excluded.
commercial units, and multiple dwelling units are also excluded.
City Ranking – Snapshot
This table ranks the cities by their annual average sales price per square foot. Only single family detached homes are
included in these numbers. Information for the large and secondary cities is current as of the date shown. Data for the
11 small cities is updated on a monthly basis, and is measured on the 13th of each month.The primary function of this
table is to show the least and most affordable areas in the Phoenix metropolitan area together with longer term pricing
trends.Annual averages are based on a relatively large number of sales. Therefore they are not as subject to rapid
change as monthly averages. The downside is that they do not necessarily represent the current market very
accurately, since they include sales from up to a year ago. Pricing may have moved a great deal since then.
Cromford Market Index
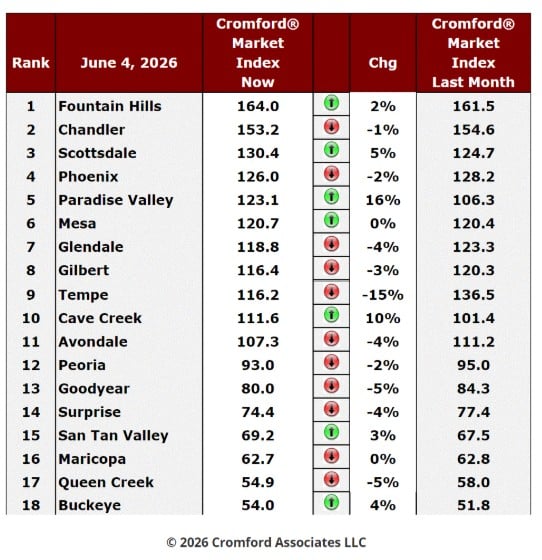
June 4 - Here is our latest table of Cromford® Market Index values for the single-family markets in the 18 largest
cities.
cities.
Cromford Market Index Commentary
The number of cities moving in a direction favorable to buyers is 11, two less than last week. We have 7 cities
moving in favor of sellers. The overall single-family detached market has once again moved in favor of buyers over
the last month. Cave Creek, Scottsdale and Paradise Valley have shown the largest percentage moves in favor of
sellers. Tempe, Goodyear and Queen Creek were the leading cities moving in favor of buyers.
The average CMI is down 0.3%, which is a smaller change than the 1.5% drop we saw last week.
The overall movement in the balance between supply and demand has been very small over the past 3 months.
Supply is declining and demand has also fallen, but only slightly. A slight change may occur now - it looks as though
we may see supply drop faster than demand during June. However, this is by no means certain as there are no
large-scale trends visible. Everything seems stuck in a kind of holding pattern.
we may see supply drop faster than demand during June. However, this is by no means certain as there are no
large-scale trends visible. Everything seems stuck in a kind of holding pattern.
NOTE: Key Cromford Metrics
• Cromford Market Index (CMI): A single score that measures the balance between supply and demand in the
residential resale market.
o Above 110: Seller's market
o 90–110: Balanced market
o Below 90: Buyer's market
Affidavits of Value – Maricopa County
residential resale market.
o Above 110: Seller's market
o 90–110: Balanced market
o Below 90: Buyer's market
Affidavits of Value – Maricopa County
Jun 5 - The affidavits of value have now been analyzed for Maricopa County's May filings and here is
what was found:
what was found:
There were 7,200 closed transactions, up 1.7% from 7,080 in May 2025 but down 2.2% from April.
There were 1,287 closed new homes, down 14% from 1,502 in May 2025 but up 14% from April.
There were 5,913 closed re-sale transactions, up 6.0% from 5,578 in May 2025 but down 5.2% from April.
The overall median sales price was $480,000, down 1.0% from May 2025 but up 1.1% from April.
The new home median sales price was $504,999, down 2.9% from May 2025 but almost unchanged from
April.
April.
The re-sale median sales price was $472,500, up 0.3% from May 2025 and up 2.4% from April.
New home closings recovered strongly after several months of slow sales. They represented 17.9% of the
market, up from 15.3% last month but still well below the 21.2% achieved this time last year.
market, up from 15.3% last month but still well below the 21.2% achieved this time last year.
New home price trends remained weaker than re-sale price trends. The new home median sales price is
2.9% lower than a year ago, while the re-sale median is up 0.3%
2.9% lower than a year ago, while the re-sale median is up 0.3%
May 2025 and May 2026 both had 21 working days, so the year-over-year numbers above need no mental
adjustments. However April 2026 22 working days and with all things being equal, the total for May should
have had fallen by 4.5% to be running at the same rate. Re-sales transactions were down 5.2%, which is
close enough I think. New homes were up 14% month-over-month which handsomely outperformed
expectations.
May 26 - The latest S&P / Case-Shiller® Home Price Index® numbers were published..
The new report covers home sales during the period January to March 2026. This means the typical home sale closed in
mid February, more than 3 months ago. Please remember that Case-Shiller data is fairly old, even on the day it is
released.
The new report covers home sales during the period January to March 2026. This means the typical home sale closed in
mid February, more than 3 months ago. Please remember that Case-Shiller data is fairly old, even on the day it is
released.
Figures for Detroit were not made available again because data was not available on time from the largest county in that
area. There were 18 cities showing rising prices, while Tampa was the only one to decline. This is a far more positive
result than last month.
area. There were 18 cities showing rising prices, while Tampa was the only one to decline. This is a far more positive
result than last month.
Comparing with the previous month's series we see the following changes:
1. Chicago +2.17%
2. San Francisco +2.05%
3. Boston +1.80%
4. Denver +1.31%
5. Seattle +1.27%
6. Washington +1.24%
7. San Diego +1.22%
8. New York +0.99%
9. Miami +0.97%
10. Portland +0.84%
11. Minneapolis +0.77%
12. Atalanta +0.73%
13. Cleveland +0.67%
14. Los Angeles +0.62%
15. Charlotte +0.59%
16. Dallas +0.56%
17. Las Vegas +0.46%
18. Phoenix +0.33%
19. Tampa -0.17%
Phoenix weakened compared with most other cities and has dropped from 16th place to 18th. The national
average was +0.72%, the second positive average we have seen in the last eight months. Phoenix was
comfortably above average 2 months ago but is less than half the average this month..
average was +0.72%, the second positive average we have seen in the last eight months. Phoenix was
comfortably above average 2 months ago but is less than half the average this month..
Comparing year over year, we see the following changes:
1. Chicago +6.09%
2. New York +4.02%
3. Cleveland +2.99%
4. Boston +2.05%
5. Minneapolis +1.79%
6. Miami +1.17%
7. Charlotte +0.93%
8. San Diego +0.78%
9. San Francisco +0.60%
10. Washington -0.13%
11. Atlanta -0.46%
12. Portland -0.85%
13. Las Vegas -1.27%
14. Los Angeles -1.60%
15. Phoenix -1.63%
16. Dallas -1.71%
17. Tampa -1.93%
18. Denver -1.95%
19. Seattle -2.50%
Phoenix is still an under-performer in the year over year table, but is now in 15th place, up one place since last
month. The average for the USA was +0.67%, so Phoenix is currently a long way below that. When inflation is
taken into account, 17 of the 19 cities have lower home prices than a year ago.
month. The average for the USA was +0.67%, so Phoenix is currently a long way below that. When inflation is
taken into account, 17 of the 19 cities have lower home prices than a year ago.