
Market Statistics Report for March 15, 2026
Market Dashboard – Cromford Index
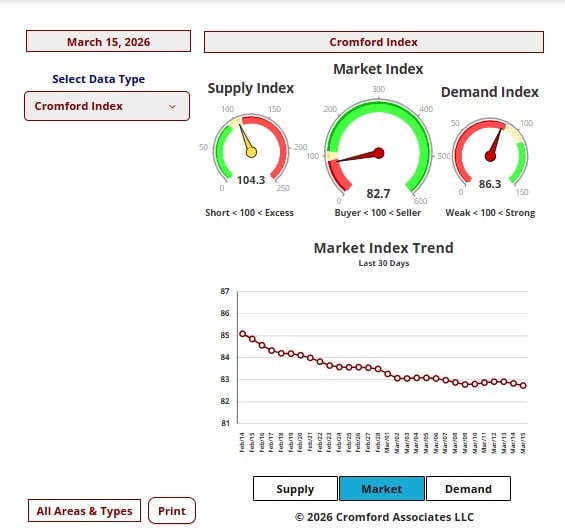
This Dashboard provides a comprehensive summary of the current state of the overall residential resale market.
All the statistics shown are for the entire Arizona Regional area as defined by ARMLS. All residential resale transactions
recorded by ARMLS are included. Geographically, this includes Maricopa County, a large part of Pinal County and a small
part of Yavapai county. In addition, "out of area" listings recorded on ARMLS are included, although these usually
constitute a very small percentage of total sales and have very little effect on the data.
All dwelling types are included. For-sale-by-owner, auctions and other non-MLS transactions are not included. Land,
commercial units, and multiple dwelling units are also excluded.
commercial units, and multiple dwelling units are also excluded.
City Ranking – Snapshot
This table ranks the cities by their annual average sales price per square foot. Only single family detached homes are
included in these numbers. Information for the large and secondary cities is current as of the date shown. Data for the
11 small cities is updated on a monthly basis, and is measured on the 13th of each month.The primary function of this
table is to show the least and most affordable areas in the Phoenix metropolitan area together with longer term pricing
trends.Annual averages are based on a relatively large number of sales. Therefore they are not as subject to rapid
change as monthly averages. The downside is that they do not necessarily represent the current market very
accurately, since they include sales from up to a year ago. Pricing may have moved a great deal since then.
Cromford Market Index
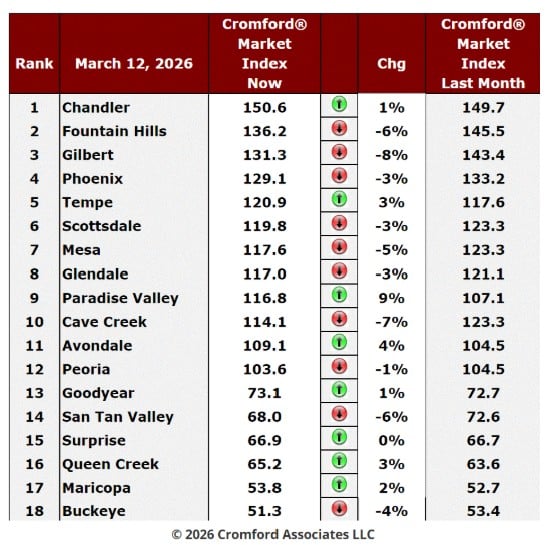
March - Here is our latest table of Cromford® Market Index values for the single-family markets in the 18 largest
cities.
cities.
Cromford Market Index Commentary
The number of cities moving in a direction favorable to buyers is 10, down from 15 last week. We have 8 cities
moving in favor of sellers (Chandler, PV, Tempe, Avondale, Goodyear, Surprise, Queen Creek and Maricopa. Of
these, PV made the most significant move.
moving in favor of sellers (Chandler, PV, Tempe, Avondale, Goodyear, Surprise, Queen Creek and Maricopa. Of
these, PV made the most significant move.
The average CMI is down 1.4%, which is less than the -3.5% movement that we saw last week. The trend in favor
of buyers decelerated over the past 3 weeks and may possibly turnaround within the next 2 weeks.
Gilbert and Cave Creek have moved in favor of buyers by 7% or more.
We have 10 cities in a sellers’ market, while 2 are in a balanced market and 6 are buyer's market. Of the 10 sellers'
markets, 5 are rather weak (less than 120).
NOTE: Key Cromford Metrics
• Cromford Market Index (CMI): A single score that measures the balance between supply and demand in the
residential resale market.
o Above 110: Seller's market
o 90–110: Balanced market
o Below 90: Buyer's market
• Cromford Market Index (CMI): A single score that measures the balance between supply and demand in the
residential resale market.
o Above 110: Seller's market
o 90–110: Balanced market
o Below 90: Buyer's market
Sales YTD Daily – $10 Million Plus Home Sales Commentary
Mar 8 - The situation in the market for homes over $10 million is extraordinary.
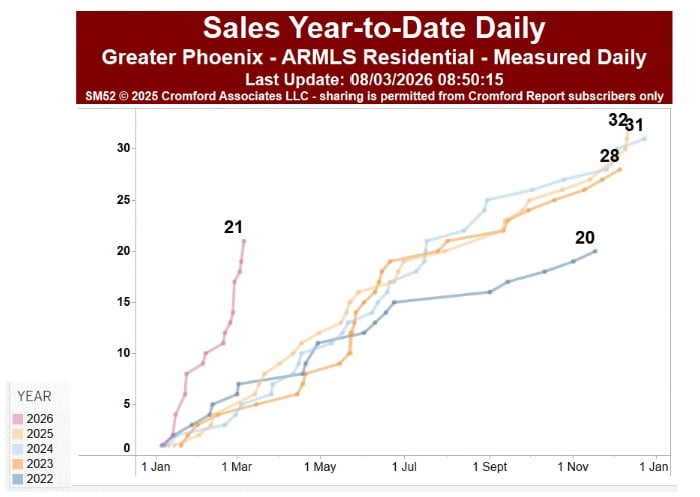
We are only in early March, and we have seen 21 transactions close for homes priced at $10 million or
more. This is more than we saw in the whole year of 2022. Even in 2025, the strongest year so far for
ultra-expensive homes, we only saw 32 closings.
more. This is more than we saw in the whole year of 2022. Even in 2025, the strongest year so far for
ultra-expensive homes, we only saw 32 closings.
The dollar volume year-to-date for the first 10 weeks is $283 million. The total for the same period
in 2025 was $77 million.
in 2025 was $77 million.
This is driving the average price for a home to unprecedented levels. A couple of dozen ultra-expensive
homes can seriously distort the average. In 2026 so far, we are looking at an average home price of
$650,424 which is up almost 3% from the same period in 2025. However, if we exclude homes over
$10 million, the average is only $627,743, barely changed from last year.
homes can seriously distort the average. In 2026 so far, we are looking at an average home price of
$650,424 which is up almost 3% from the same period in 2025. However, if we exclude homes over
$10 million, the average is only $627,743, barely changed from last year.
Listings Under Contract
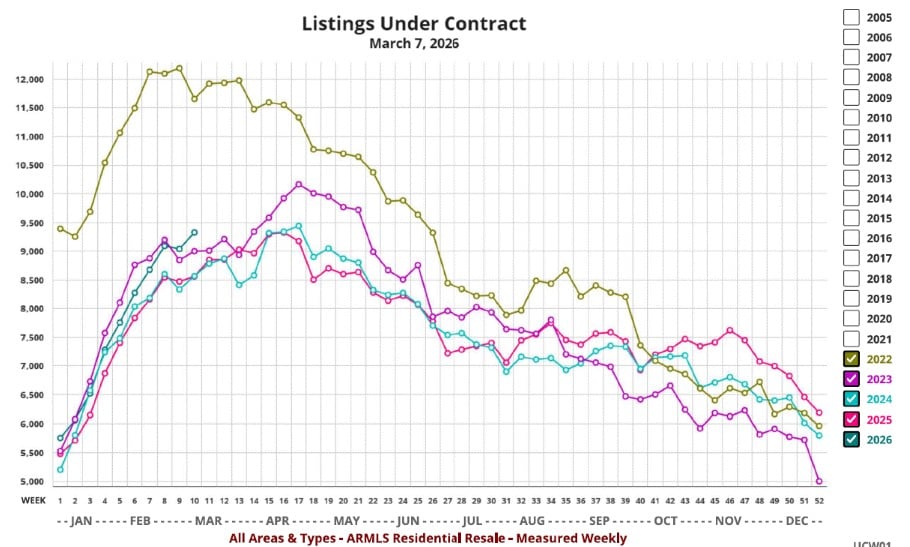
Mar 7 - An encouraging reading for listings under contract for this week means we now have 2 weeks in a row
where there are more listings under contract than at the same time in any of the last 3 years.
where there are more listings under contract than at the same time in any of the last 3 years.
We still have a long way to go before we even approach the levels of 2021 or 2022, but the last 2 weeks have
been much better than the previous 8.
been much better than the previous 8.
The gap between 2025 and 2026 is now widening and even though interest rates have risen in the last
week, they remain well below this time last year.
week, they remain well below this time last year.
Meanwhile active listing counts are no longer rising, so if the market can keep this going for another 2 weeks
we should see the Cromford® Market Index change direction and start to move higher again.
we should see the Cromford® Market Index change direction and start to move higher again.