
Market Statistics Report for March 31, 2026
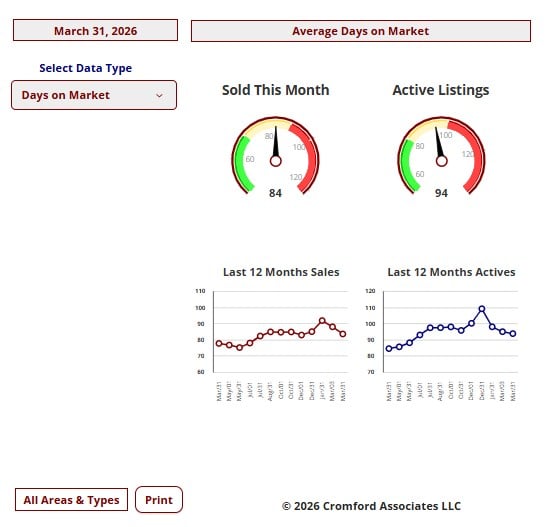
Market Dashboard – Days on Market
This Dashboard provides a comprehensive summary of the current state of the overall residential resale market.
All the statistics shown are for the entire Arizona Regional area as defined by ARMLS. All residential resale transactions
recorded by ARMLS are included. Geographically, this includes Maricopa County, a large part of Pinal County and a small
part of Yavapai county. In addition, "out of area" listings recorded on ARMLS are included, although these usually
constitute a very small percentage of total sales and have very little effect on the data.
All dwelling types are included. For-sale-by-owner, auctions and other non-MLS transactions are not included. Land,
commercial units, and multiple dwelling units are also excluded.
commercial units, and multiple dwelling units are also excluded.
City Ranking – Snapshot
This table ranks the cities by their annual average sales price per square foot. Only single family detached homes are
included in these numbers. Information for the large and secondary cities is current as of the date shown. Data for the
11 small cities is updated on a monthly basis, and is measured on the 13th of each month.The primary function of this
table is to show the least and most affordable areas in the Phoenix metropolitan area together with longer term pricing
trends.Annual averages are based on a relatively large number of sales. Therefore they are not as subject to rapid
change as monthly averages. The downside is that they do not necessarily represent the current market very
accurately, since they include sales from up to a year ago. Pricing may have moved a great deal since then.
Cromford Market Index
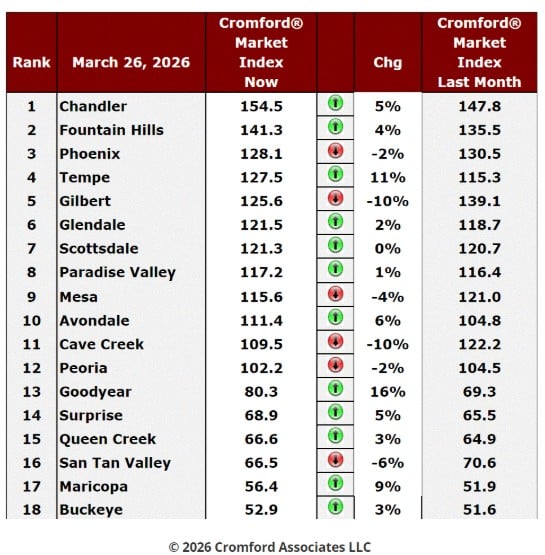
March - Here is our latest table of Cromford® Market Index values for the single-family markets in the 18 largest
cities.
cities.
Cromford Market Index Commentary
The number of cities moving in a direction favorable to buyers is 6, 4 fewer than last week. We have 12 cities
moving in favor of sellers. Perhaps surprisingly given the sharp increase in interest rates, the market is moving in
favor of sellers. Of these, Goodyear, Tempe and Maricopa made the largest percentage moves. Cave Creek and
Gilbert were the leading cities moving in favor of buyers.
moving in favor of sellers. Perhaps surprisingly given the sharp increase in interest rates, the market is moving in
favor of sellers. Of these, Goodyear, Tempe and Maricopa made the largest percentage moves. Cave Creek and
Gilbert were the leading cities moving in favor of buyers.
The average CMI is up 1.7%, which is significantly better for sellers than the 0.2% movement that we saw last
week.
week.
We have 10 cities in a sellers’ market, while 2 are in a balanced market and 6 are buyer's markets. Of the 10
sellers' markets, 3 are rather weak (CMI is less than 120).
sellers' markets, 3 are rather weak (CMI is less than 120).
Mar 23 - Plenty of drama outside the housing market, but despite a sharp increase in interest rates, demand
seems fairly stable. Active listing counts continue to increase, which is disappointing to sellers, who have to
compete with each other more than they would like. So far the 2026 market seems quite resilient, and prices
show no sign of fragility.
seems fairly stable. Active listing counts continue to increase, which is disappointing to sellers, who have to
compete with each other more than they would like. So far the 2026 market seems quite resilient, and prices
show no sign of fragility.
NOTE: Key Cromford Metrics
• Cromford Market Index (CMI): A single score that measures the balance between supply and demand in the
residential resale market.
o Above 110: Seller's market
o 90–110: Balanced market
o Below 90: Buyer's market
S&P/Case-Shiller Home Price Index
• Cromford Market Index (CMI): A single score that measures the balance between supply and demand in the
residential resale market.
o Above 110: Seller's market
o 90–110: Balanced market
o Below 90: Buyer's market
S&P/Case-Shiller Home Price Index
Mar 31 - The latest S&P / Case-Shiller® Home Price Index® numbers were published today.
The new report covers home sales during the period November 2025 to January 2026. This means the typical home
sale closed in mid December, more than 3 months ago. Please remember that Case-Shiller data is fairly old, even
on the day it is released.
The new report covers home sales during the period November 2025 to January 2026. This means the typical home
sale closed in mid December, more than 3 months ago. Please remember that Case-Shiller data is fairly old, even
on the day it is released.
Figures for Detroit were not made available again because data was not available from the largest county in that
area. There were 5 cities showing rising prices, while the other 14 showed falling prices compared with the month
before,
area. There were 5 cities showing rising prices, while the other 14 showed falling prices compared with the month
before,
Comparing with the previous month's series we see the following changes:
1. Miami +0.43%
2. Charlotte +0.24%
3. Washington +0.08%
4. Phoenix +0.06%
5. Los Angeles +0.05%
6. Mew York -0.03%
7. Las Vegas -0.06%
8. Boston -0.11%
9. Denver -0.15%
10. Chicago -0.16%
11. Cleveland -0.21%
12. Portland -0.24%
13. Tampa -0.26%
14. San Francisco -0.27%
15. San Diego -0.31%
16. Minneapolis -0.38%
17. Dallas -0.41%
18. Atlanta -0.45%
19. Seattle -0.59%
S&P/Case-Shiller Home Price Index – Continued
Phoenix has risen from 10th place to 4th. The national average was -0.11%, the sixth negative average we
have seen in the last year. Phoenix was comfortably above this average.
have seen in the last year. Phoenix was comfortably above this average.
Comparing year over year, we see the following changes:
1. New York +4.93%
2. Chicago +4.63%
3. Cleveland +3.56%
4. Minneapolis +2.49%
5. Boston +1.32%
6. Charlotte +1.13%
7. San Diego +0.51%
8. Los Angeles +0.25%
9. Washington +0.19%
10. Atlanta -0.13%
11. San Francisco -0.42%
12. Seattle -0.62%
13. Miami -0.90%
14. Las Vegas -0.95%
15. Portland -1.04%
16. Dallas -1.47%
17. Phoenix -1.59%
18. Denver -2.05%
19. Tampa -2.54%
In contrast to its performance month to month, Phoenix is still an under-performer in the year over year table, in 17th
place, the same as for the last two months.
place, the same as for the last two months.
The average for the USA was +0.91%, so Phoenix is currently a some way below that. When inflation is taken into
account, 16 of the cities have lower home prices than a year ago.
account, 16 of the cities have lower home prices than a year ago.