
Market Statistics Report for October 14, 2026
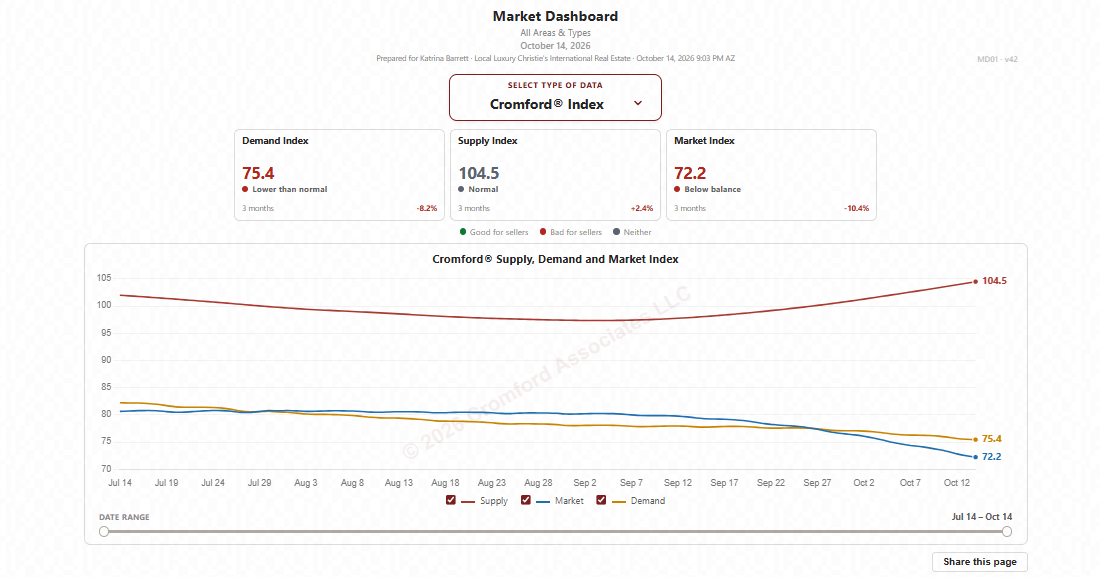
Market Dashboard – Cromford Index
This Dashboard provides a comprehensive summary of the current state of the overall residential resale market. The data is current as of the date shown and is updated daily.
All the statistics shown are for the entire Arizona Regional area as measured by ARMLS.
All residential resale transactions recorded by ARMLS are included. All dwelling types are included. For-sale-by-owner, auctions and other non-MLS transactions are not included. Land, commercial units, and multiple dwelling units are also excluded.
City Ranking – Snapshot
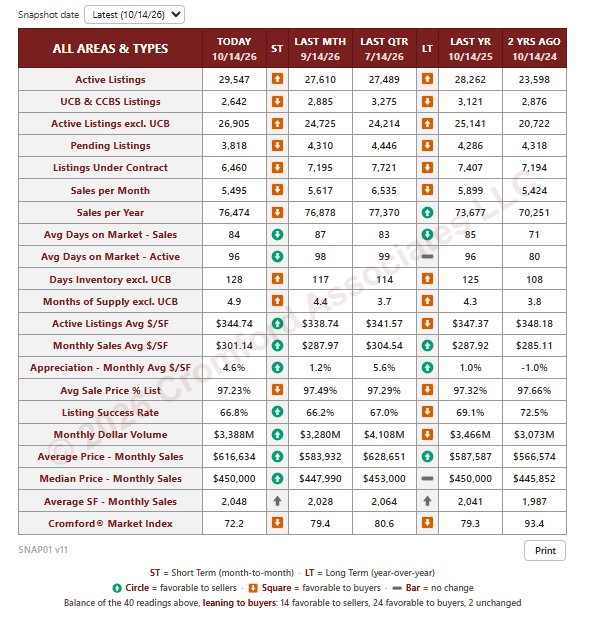
The table below provides a concise statistical summary of today's residential resale market in the Phoenix metropolitan area.
The figures shown are for the entire Arizona Regional area as defined by ARMLS. All residential resale transactions recorded by ARMLS are included. Geographically, this includes Maricopa county, the majority of Pinal county and a small part of Yavapai county. Southeastern Arizona and the Sedona / Valley Verde areas are also included. In addition, "out of area" listings recorded in ARMLS are included, although these constitute a small percentage (typically less than 1%) of total sales and have little effect on the statistics.
All dwelling types are included. For-sale-by-owner, auctions and other non-MLS transactions are not included. Land, commercial units, and multiple dwelling units are also excluded.
Cromford Market Index
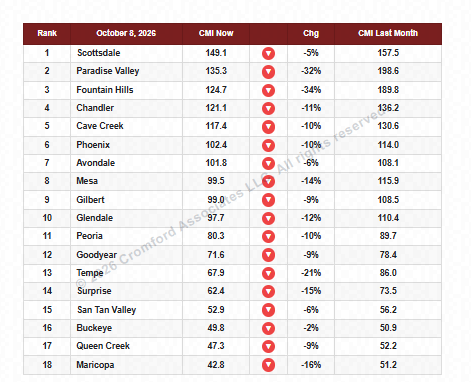
Oct - Here is our latest table of Cromford® Market Index values for the single-family markets in the 18 largest cities.
Cromford Market Index Commentary
The average CMI is down 12.9% from last month, a further slide from last week’s 11.2% decline and the weakest reading since November 2023. The trend has deteriorated every week since mid-August, and all 18 cities are moving in a buyer-favorable direction.
The biggest moves are again just below the top of the table. Fountain Hills is down 34%, and Paradise Valley is down 32%. Fountain Hills has 25% more supply than a month ago and Paradise Valley 21% more, while demand has fallen 18% in both. Scottsdale remains in first place, and its lead over Paradise Valley has widened to 13.8 points from 7.8 last week. Demand is still up 3% month over month, but supply is up 9%, so its index has slipped 5%.
Supply is now higher than a month ago in all 18 cities. Demand is weaker in 16 of the 18, with only Scottsdale and Buckeye showing an increase. After Fountain Hills and Paradise Valley, Tempe (-21%), Maricopa (-16%), and Surprise (-15%) have moved the furthest toward buyers, the same five cities as last week. The smallest declines are in Buckeye (-2%), Scottsdale (-5%), and Avondale and San Tan Valley (both -6%).
We still have 5 cities in a seller’s market, 5 balanced, and 8 in a buyer’s market, and every city holds the same rank as last week. Within the balanced group, Mesa (99.5), Gilbert (99.0), and Glendale (97.7) have all slipped below 100 this week, leaving only Phoenix (102.4) and Avondale (101.8) above it. At the bottom, Buckeye has dropped below 50 to 49.8, and Maricopa remains last at 42.8.
NOTE: Key Cromford Metrics
- Cromford Market Index (CMI): A single score that measures the balance between supply and demand in the residential resale market.
- o Above 110: Seller's market
- o 90–110: Balanced market
- o Below 90: Buyer's market
Northeast Valley: How Is It Different
October 10, 2026
By now, we all know that the Northeast Valley has been the standout region for price per square foot over the last 4 years. For homes that closed in the 12 months to August 2026, the median $/SF is $425.73. That is 2.8% higher than a year earlier and 11.6% higher than three years earlier, when it was $381.50. No other Greater Phoenix region comes close. For the other seven Greater Phoenix regions combined, the median $/SF is $242.88, down 1.5% from a year earlier and up just 1.0% from three years earlier, when it was $240.57. These numbers are based on county-level residential sales (excluding trustee sales), not just ARMLS closed listings.
The key question is whether those Northeast Valley homes are really worth more, or whether it is because more expensive homes are in the mix. The answer is a bit of both, but mostly the former over three years.
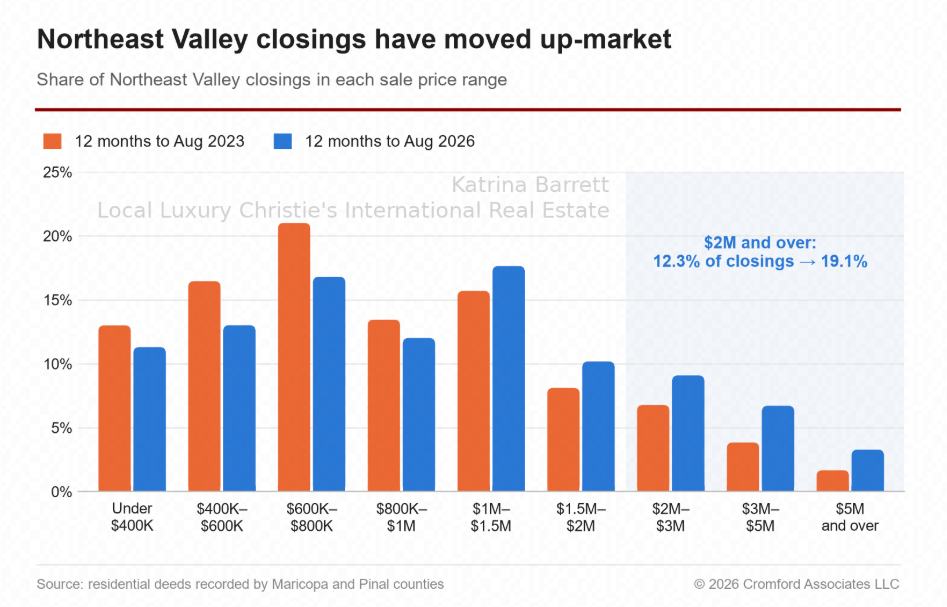
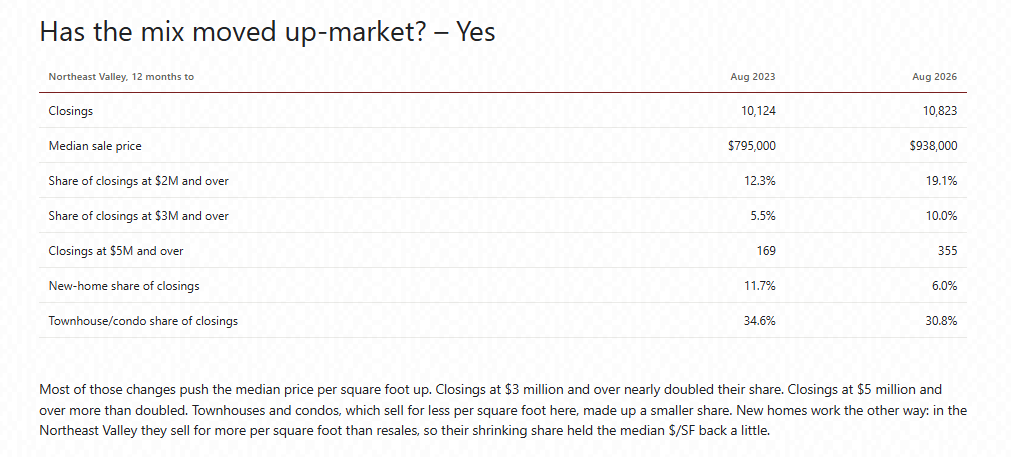
Has the mix moved up-market? – Yes
Most of those changes push the median price per square foot up. Closings at $3 million and over nearly doubled their share. Closings at $5 million and over more than doubled. Townhouses and condos, which sell for less per square foot here, made up a smaller share. New homes work the other way: in the Northeast Valley they sell for more per square foot than resales, so their shrinking share held the median $/SF back a little.
But homes have appreciated as well
Holding the mix of ZIP codes and dwelling types steady, the Northeast Valley’s price per square foot rose 9.4% over three years. Among 771 homes that sold in both the 12 months to August 2023 and the 12 months to August 2026, the typical home sold for 10.5% more the second time. For the rest of Greater Phoenix, that figure was only 2.8%.
So of the 11.6% headline rise, 1 to 2 percentage points came from the changing mix of homes sold, and the rest is genuine appreciation. Some of those resold homes were probably renovated between sales, so we should treat the like-for-like gain as about 9% to 10%.
The past year is a different story, however.
Like-for-like, the Northeast Valley gained just 0.7%, so much of its 2.8% headline gain came from the mix. That is still better than every other region, all of which declined like-for-like across all home types.
Gains across nearly every price range
Among homes that sold in both periods, gains were broad. Homes that first sold for between $1.5 million and $2 million rose 18.2%. Homes that first sold for between $800,000 and $1 million rose 14.9%. The one exception was homes that first sold for under $400,000, which slipped 1.5%. That group of 78 homes is small, and all but one are townhouses or condos, consistent with the relative weakness we see in townhouses and condos across the whole valley.
Expensive homes have done well across Greater Phoenix, not just here. Outside the Northeast Valley, homes that first sold for $1 million or more rose 12.1%, close to the Northeast Valley’s 13.6%. The difference lies in the middle of the market: homes that first sold for between $500,000 and $1 million rose 10.7% in the Northeast Valley, against just 3.4% in the other seven regions combined. The Northeast Valley also has far more expensive homes. Homes of $1 million or more made up 46.9% of its closings in the 12 months to August 2026, against only 4.4% in the other seven regions combined.
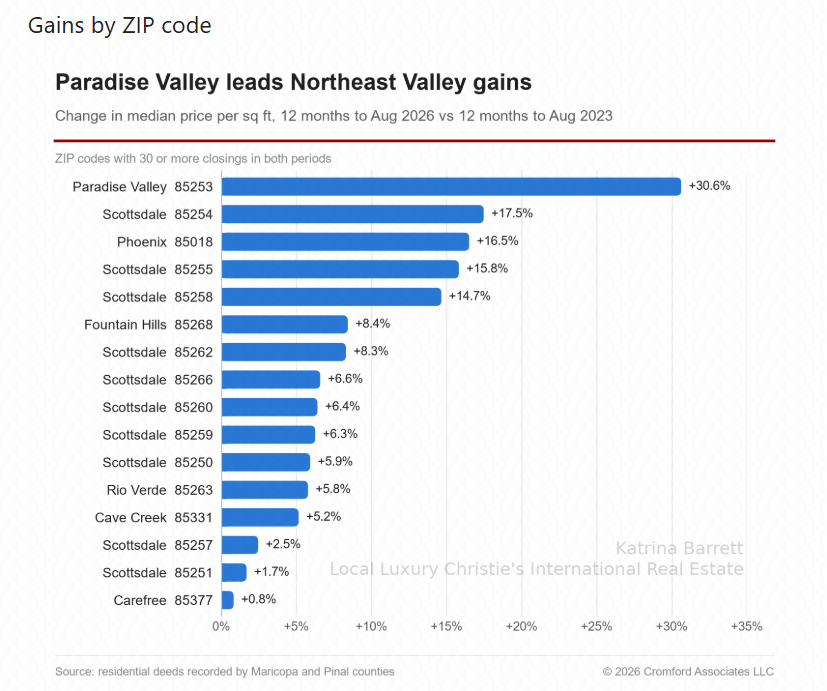
Paradise Valley leads by a wide margin. At the other end, Carefree (85377) and Scottsdale’s 85251 and 85257 have barely moved in three years. The ZIP code figures are headline medians, so they still include mix changes within each ZIP code.
To Conclude
The Northeast Valley’s rise isn’t just a trend toward ultra-luxury homes. More expensive homes are selling, and that has inflated the headline figure, but homes in the Northeast Valley are also genuinely worth, typically, around 9% to 10% more per square foot than they were three years ago, while no other region as a whole has gained more than 2% like-for-like across all home types, although homes of $1 million or more have also risen strongly elsewhere. Over the past year, however, the like-for-like gain has slowed to under 1%. If you are quoting the 2.8% one-year figure to Northeast Valley clients, you should know that much of the very recent gain reflects the mix of what sold rather than a change in what homes are worth.
Derived from residential deeds recorded by Maricopa and Pinal counties. Regions are Cromford regions.