
Market Statistics Report for September 18, 2025
Market Dashboard – Dashboard Cromford Index
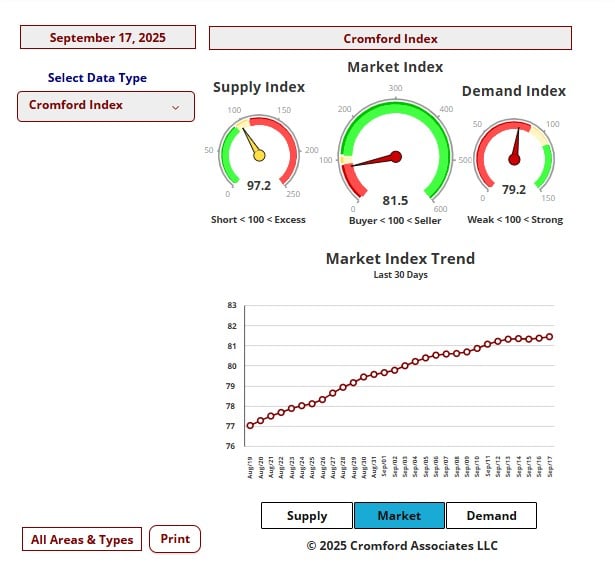
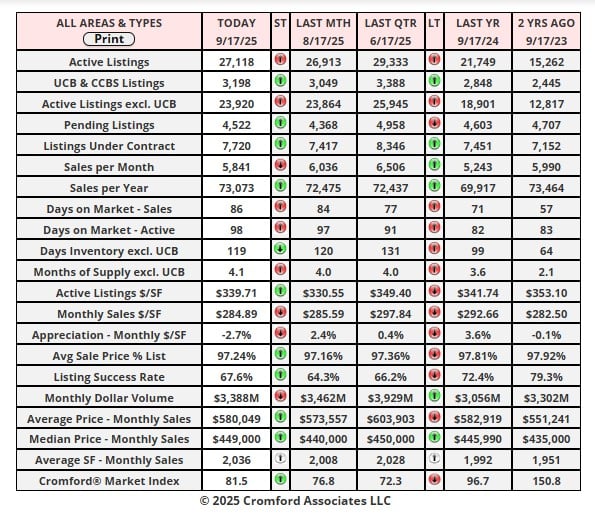
This Dashboard provides a comprehensive summary of the current state of the overall residential resale market.
All the statistics shown are for the entire Arizona Regional area as defined by ARMLS. All residential resale transactions
recorded by ARMLS are included. Geographically, this includes Maricopa County, a large part of Pinal County and a small
part of Yavapai county. In addition, "out of area" listings recorded on ARMLS are included, although these usually
constitute a very small percentage of total sales and have very little effect on the data.
All dwelling types are included. For-sale-by-owner, auctions and other non-MLS transactions are not included. Land,
commercial units, and multiple dwelling units are also excluded.
City Ranking – Snapshot
This table ranks the cities by their annual average sales price per square foot. Only single family detached homes are
included in these numbers. Information for the large and secondary cities is current as of the date shown. Data for the
11 small cities is updated on a monthly basis, and is measured on the 13th of each month.The primary function of this
table is to show the least and most affordable areas in the Phoenix metropolitan area together with longer term pricing
trends.Annual averages are based on a relatively large number of sales. Therefore they are not as subject to rapid
change as monthly averages. The downside is that they do not necessarily represent the current market very
accurately, since they include sales from up to a year ago. Pricing may have moved a great deal since then.
Cromford Market Index
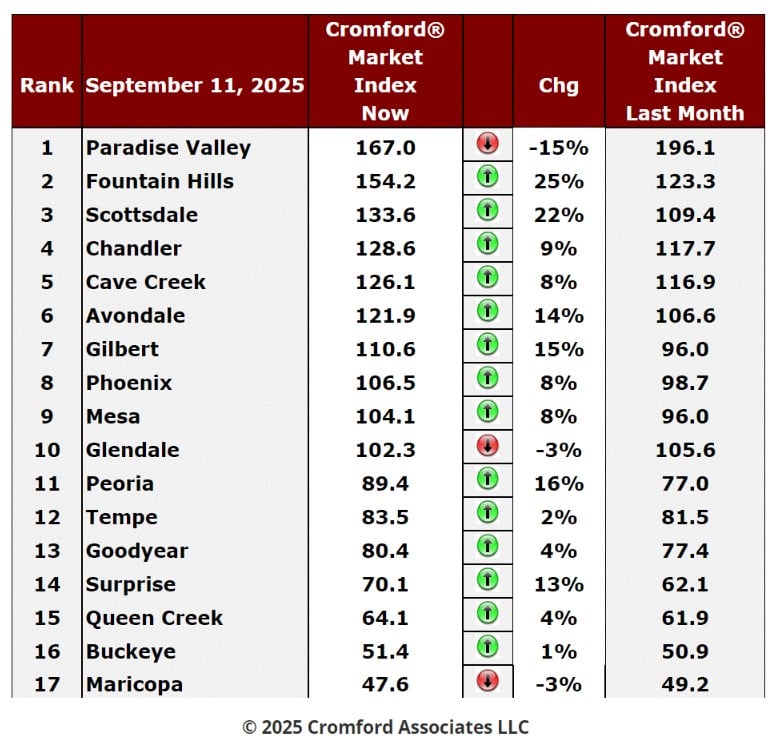
Sept 11 - Here is our latest table of Cromford® Market Index values for the single-family markets in the 17 largest
cities.
Sept 11 - Here is our latest table of Cromford® Market Index values for the single-family markets in the 17 largest
cities.
Cromford Market Index Commentary
Although we are still seeing movement favorable to sellers, it is starting to decelerate. This occurred last week and
we see it again this week. The average monthly change in CMI is 7.6%, which is a little less strong than the 8.4%
we saw last week. Demand is growing nicely, but a lot of sellers are also putting homes back on the market from
listings that were cancelled during the summer months. The pace of arrival of new listings is higher than in both the
last 2 years.
14 cities improved for sellers with 3 improving for buyers. Paradise Valley, Glendale and Maricopa did the latter
with Tempe turning around. The front-runners are Fountain Hills, Scottsdale, Peoria, Gilbert, Avondale and
Surprise. Paradise Valley is falling back quickly as supply comes back online and is in danger of being overtaken
by Fountain Hills at the top of the table.
We have 7 cities that are seller's markets, with Gilbert joining that group. 3 are balanced and 7 are still buyer's
markets. Peoria looks like it will leave that group and become a balanced market with a day or two.
It is mostly the more affordable areas that are the most favorable to buyers, but Avondale is a notable exception to
that rule. Its supply is far more limited than Buckeye or Maricopa, for example.
Listings Under Contract
Above 1 Million
Sep 14 - With the typical 30-year fixed mortgage at 6.3%, we can see a distinct uptick in contract activity over the
past several weeks. The trend is best observed in the market over $1 million:
past several weeks. The trend is best observed in the market over $1 million:
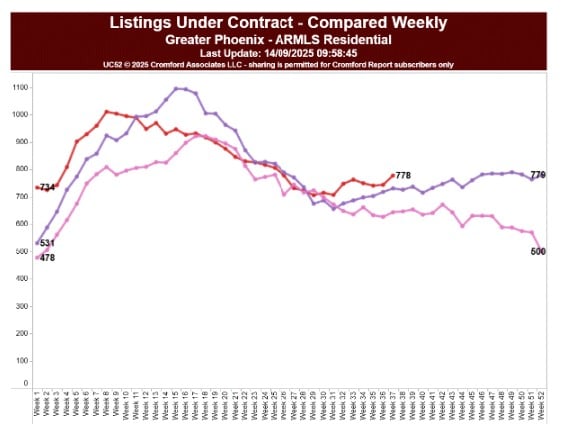
Here we can see 6 weeks of upward movement reaching 778 - a 6.4% improvement over 731 at this point last
year (the violet line) and 20.8% higher than in September 2023.
2 to 5 Million
The most substantial improvement is in the range $1 million to $1.5 million, which is up 15.8% compared to this
time last year and has seen 9 weeks of upward trend. The $2 million to $10 million range is slightly down
compared to a year ago, but there are 10 homes over $10 million under contract which is 30% higher than the 7
we counted last year at this time.
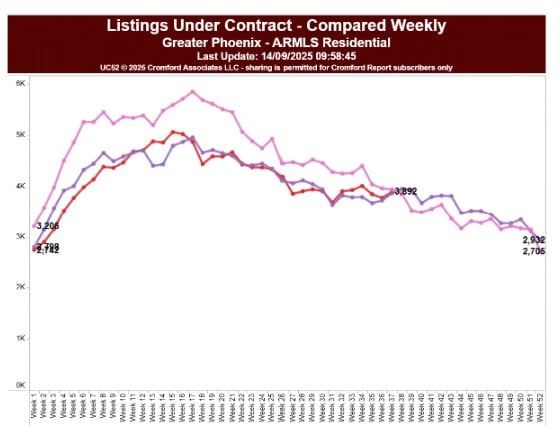
550K to 1 Million
There is also plenty more contract activity between $500,000 and $1 million. The increase over last year is 5.4%,
and 14.8% compared with September 2023.
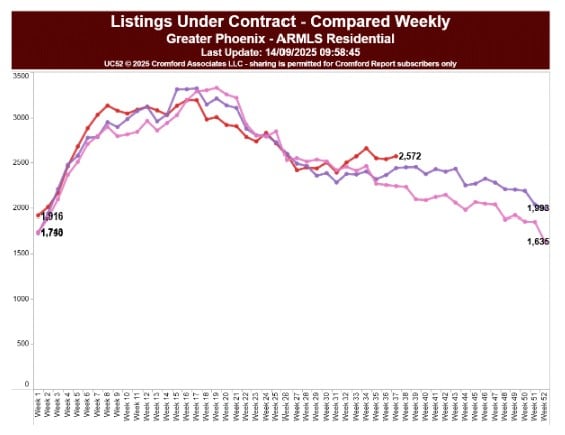
It is the market below $500,000 that seems unimpressed:
and 14.8% compared with September 2023.
It is the market below $500,000 that seems unimpressed:
***There has been some progress over the last 6 weeks, but 2025 contract levels are essentially no higher than
last year or the year before. Given that pricing is lower than 2024 and 2023, this is disappointing. The entry-level
market is still suffering from abnormally low demand.
last year or the year before. Given that pricing is lower than 2024 and 2023, this is disappointing. The entry-level
market is still suffering from abnormally low demand.