Market Statistics Report for April 10, 2024
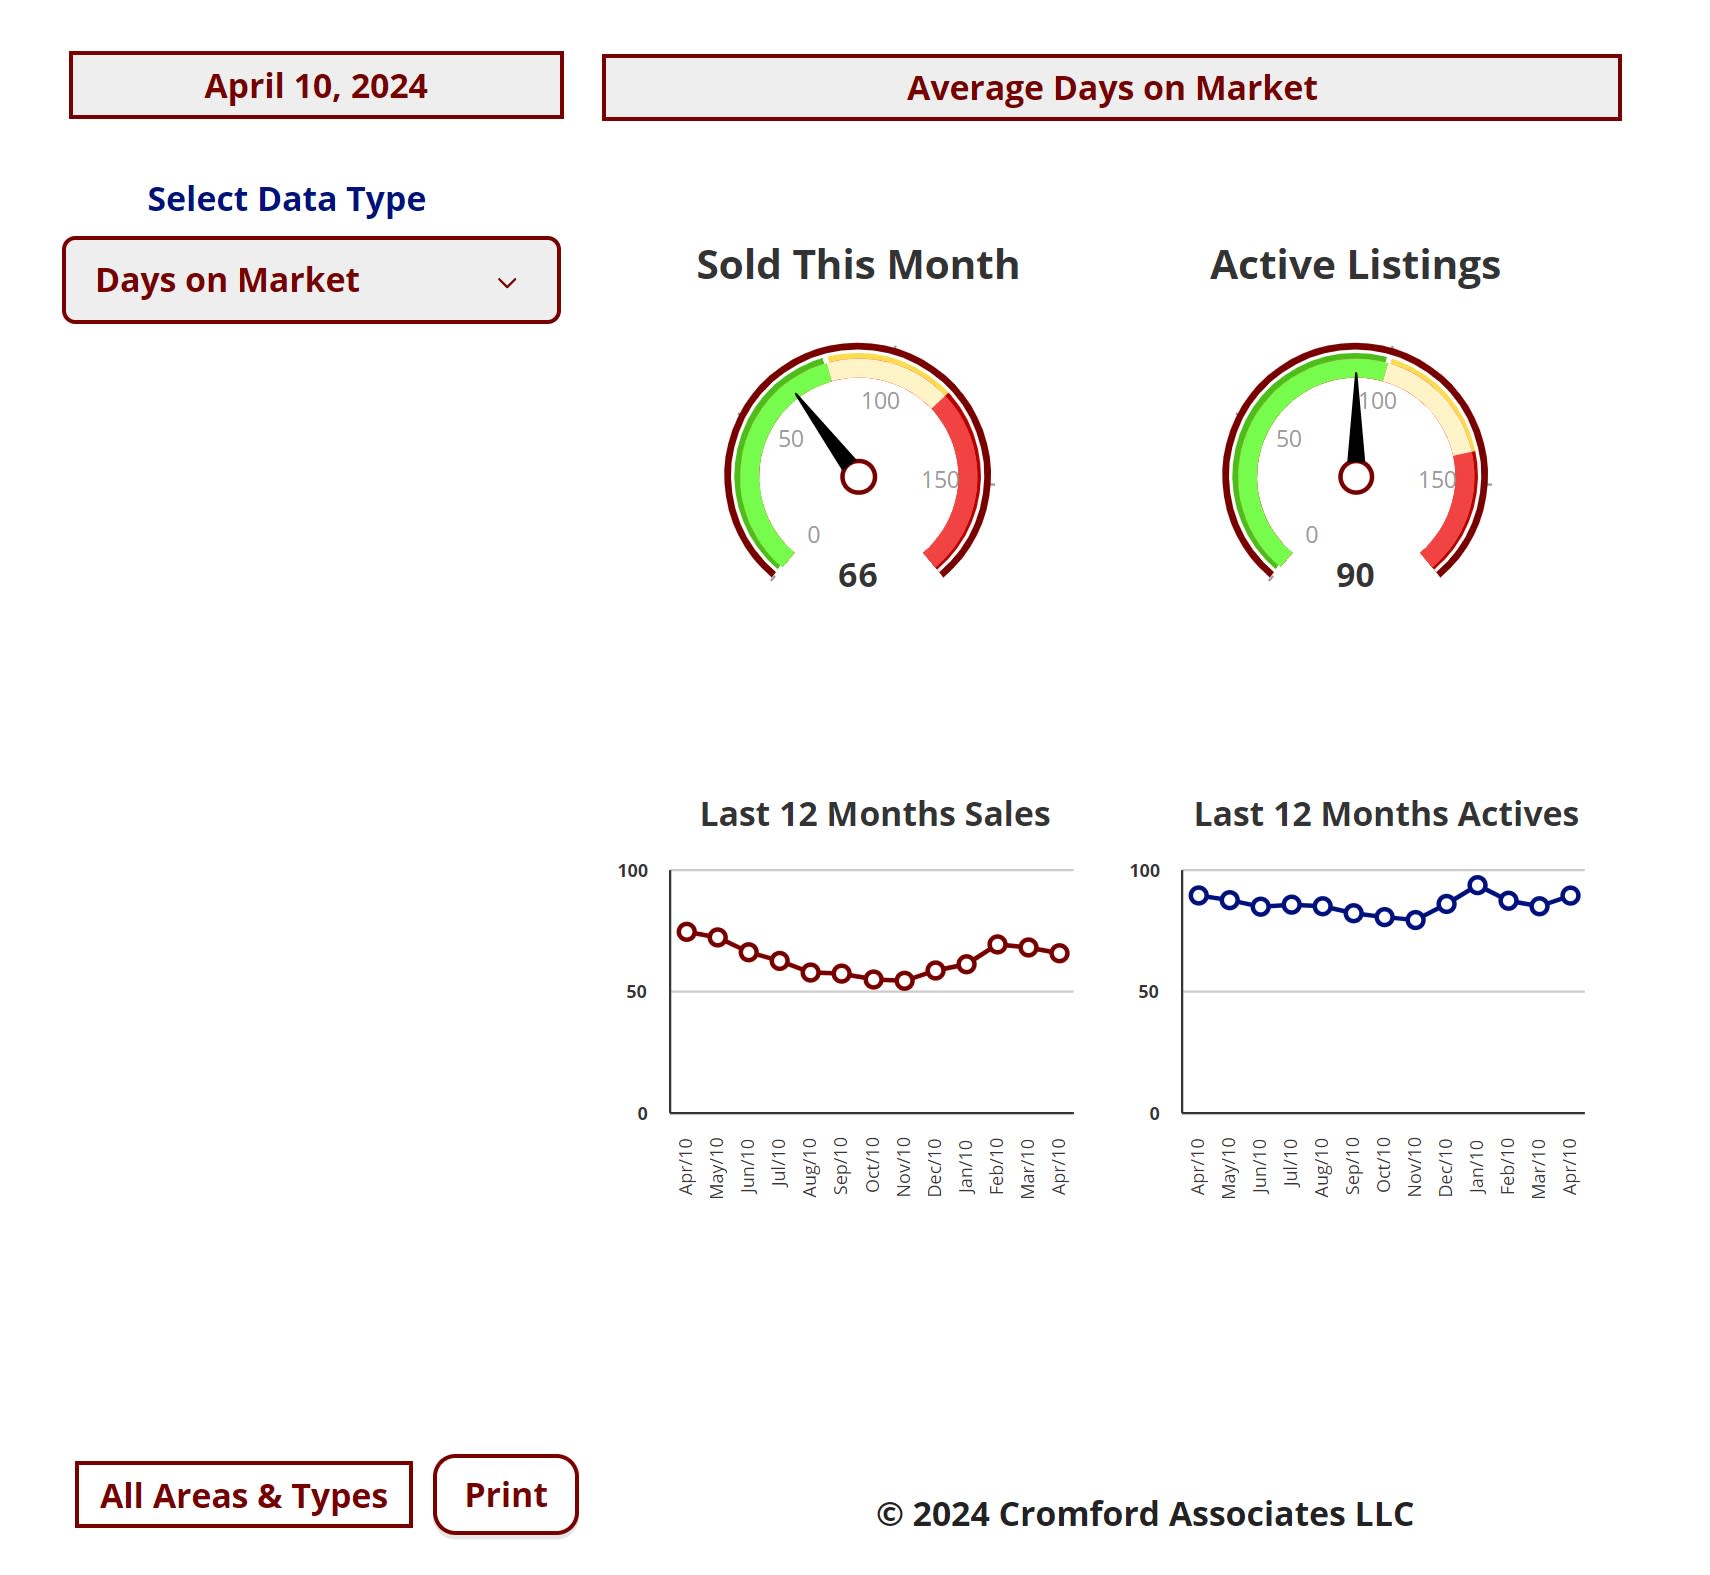
Market Dashboard – Average Days on Market
All the statistics shown are for the entire Arizona Regional area as defined by ARMLS. All residential resale transactions
recorded by ARMLS are included. Geographically, this includes Maricopa county, a large part of Pinal county and a small
part of Yavapai county. In addition, "out of area" listings recorded on ARMLS are included, although these usually
constitute a very small percentage of total sales and have very little effect on the data.
All dwelling types are included. For-sale-by-owner, auctions and other non-MLS transactions are not included. Land,
commercial units, and multiple dwelling units are also excluded.
Daily Market Snapshot – City Ranking
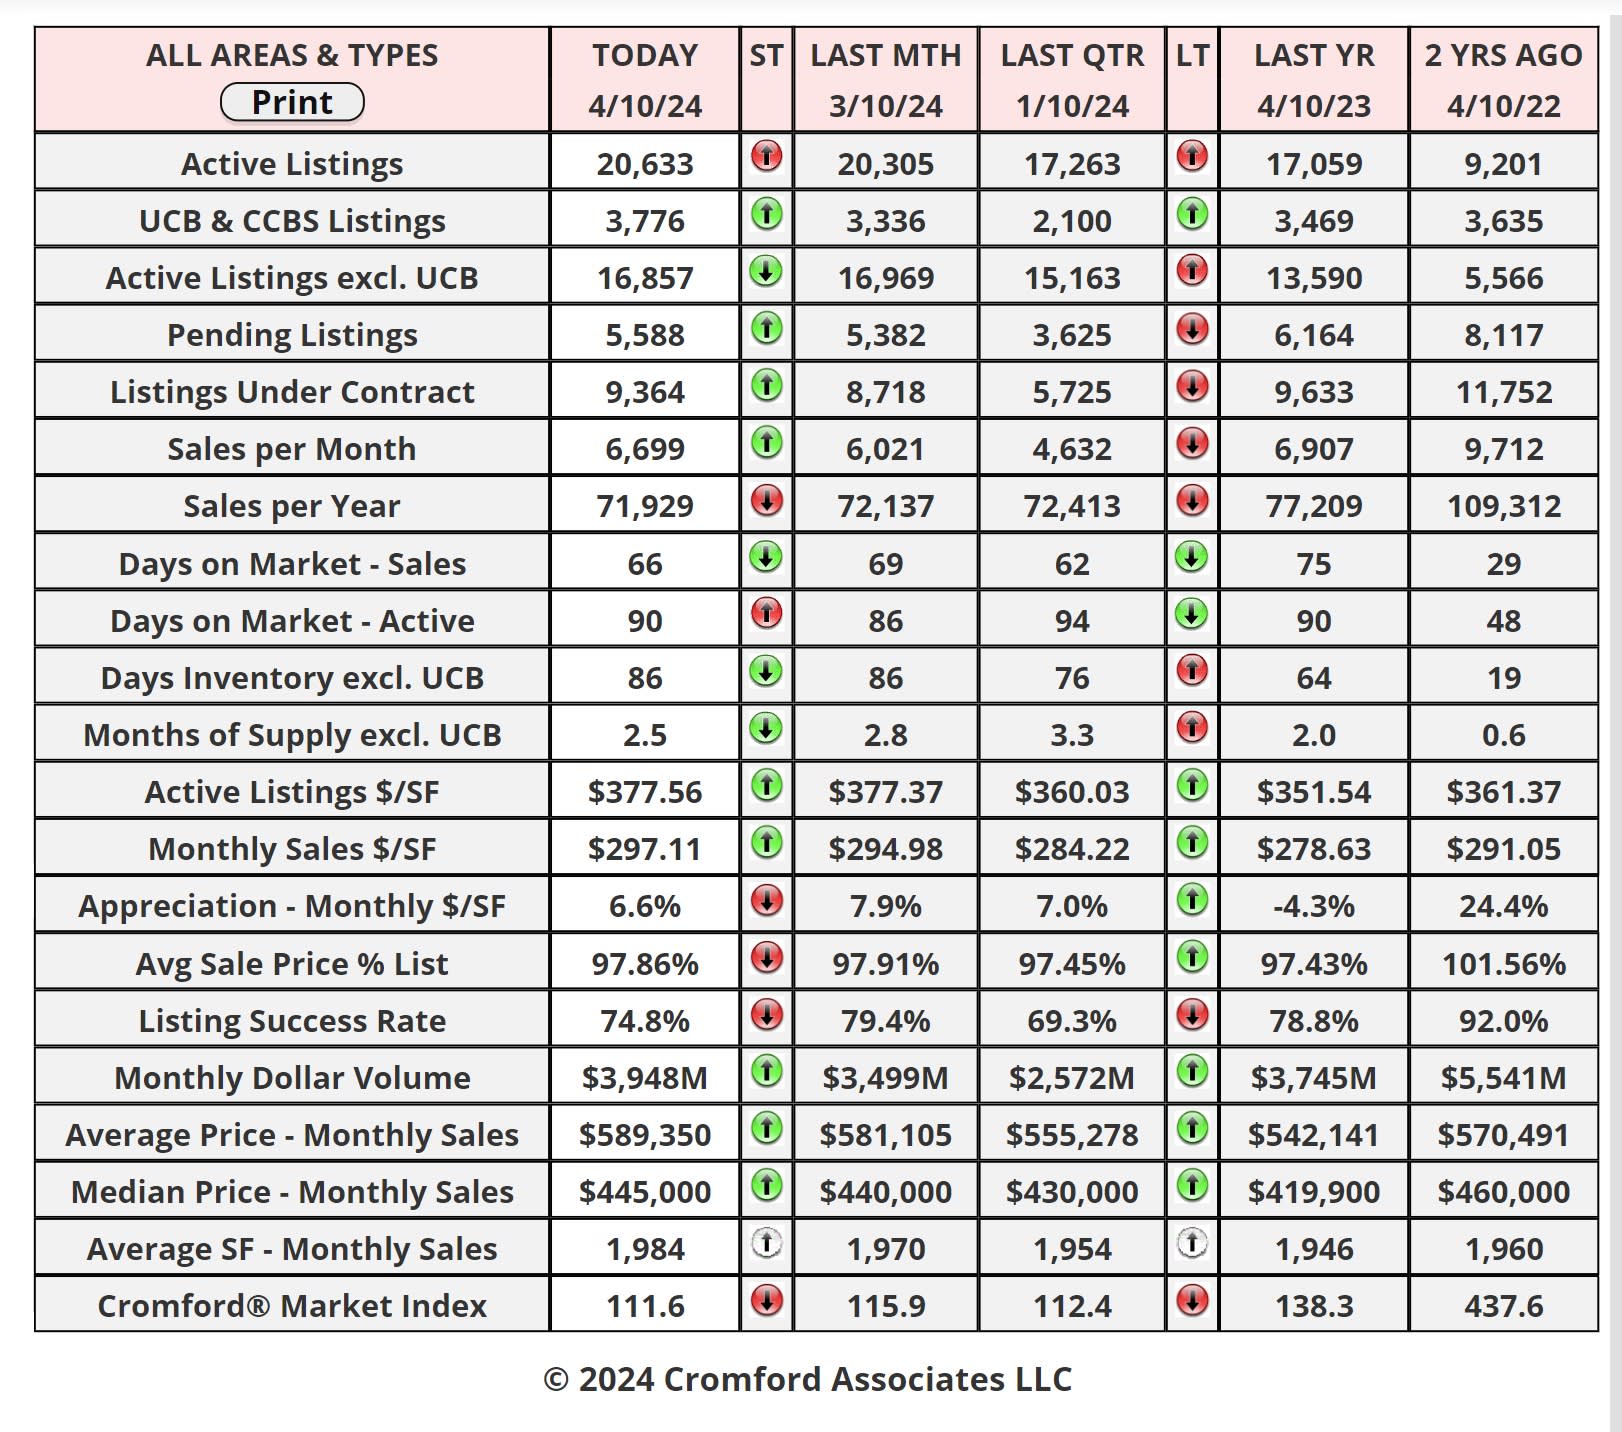
area. The figures shown are for the entire Arizona Regional area as defined by ARMLS. All residential resale transactions
recorded by ARMLS are included. Geographically, this includes Maricopa county, the majority of Pinal county and a small
part of Yavapai county. In addition, "out of area" listings recorded in ARMLS are included, although these constitute a very
small percentage (typically less than 1%) of total sales and have very little effect on the statistics.
Cromford Market Index
cities.
Cromford Market Index Commentary
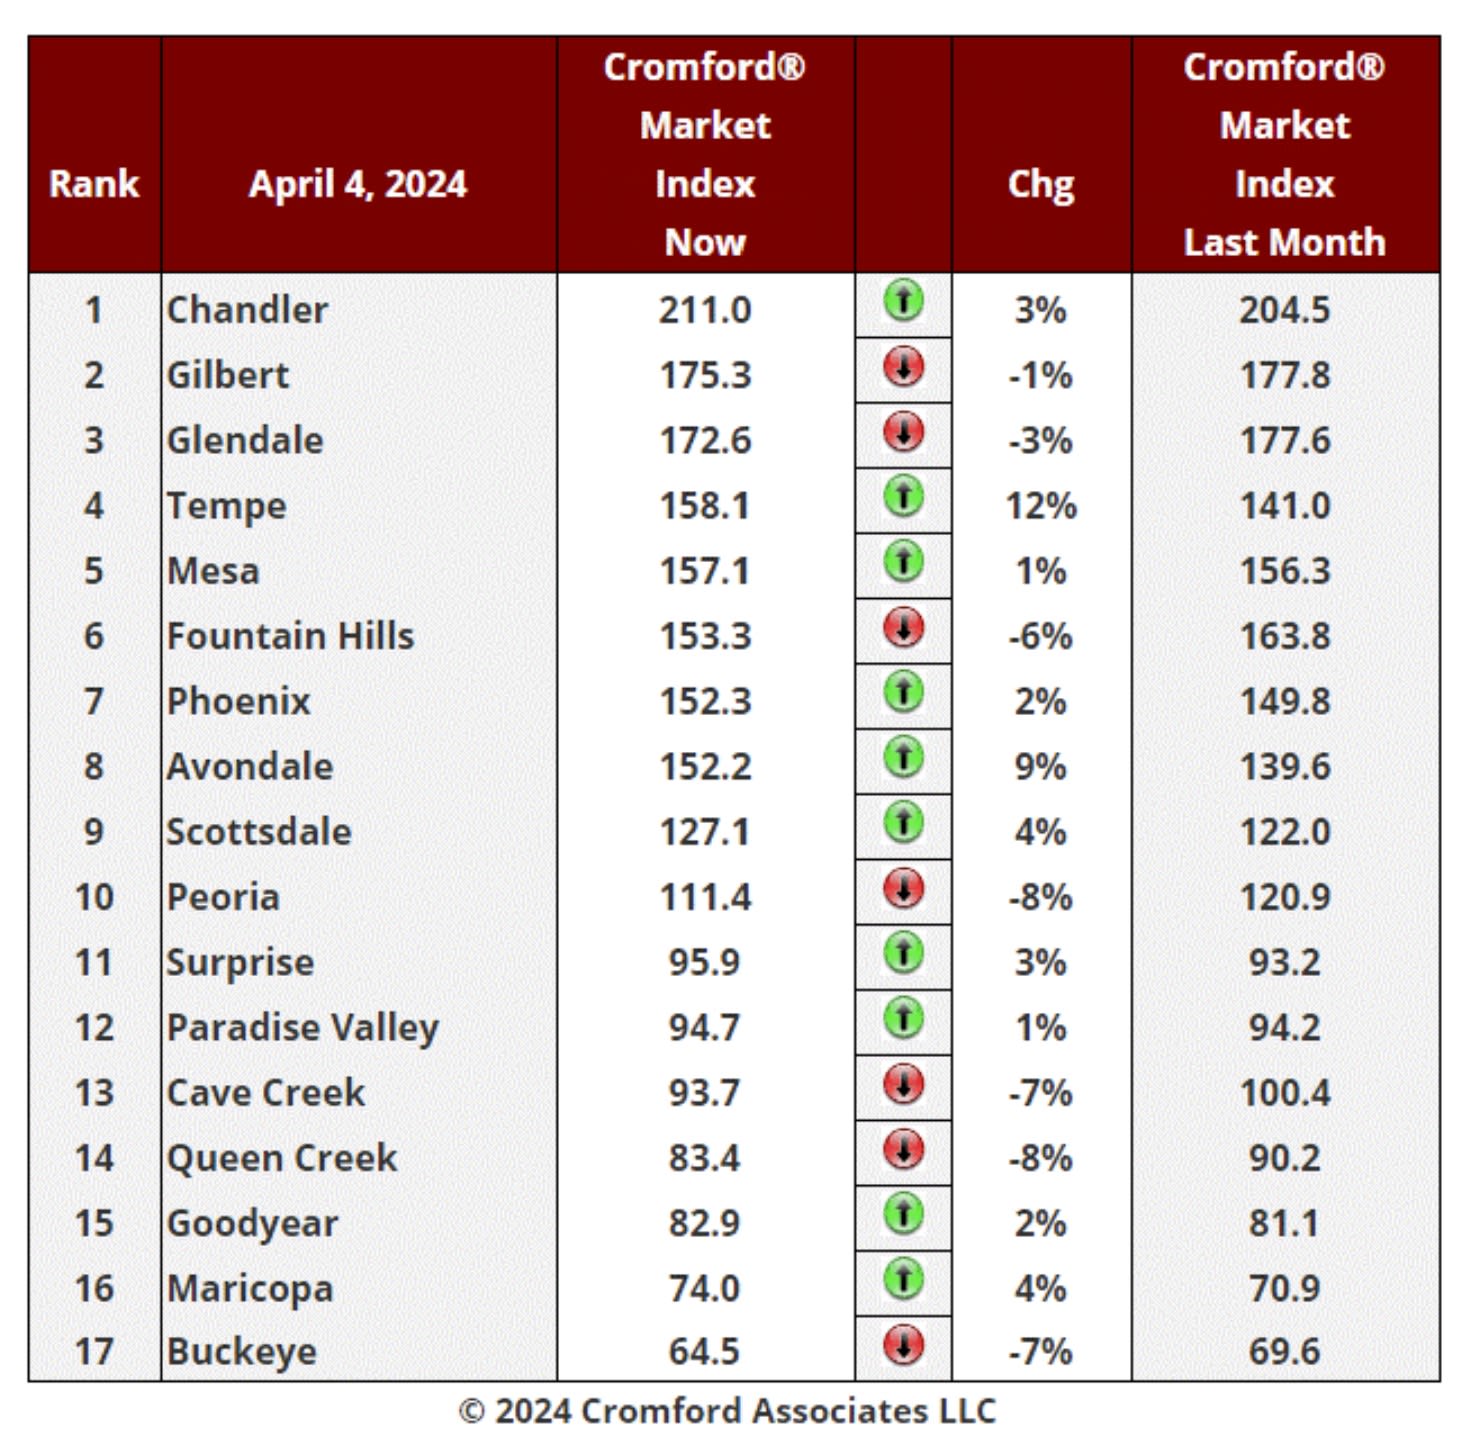
The average change in CMI over the past month is zero, down from +0.4% last week.
We have 10 cities showing an increase in their Cromford® Market Index over the past month, while 7 have declined.
This is an improvement over last week. an improvement for sellers instead of a deterioration.
Tempe and Avondale are the primary moves in favor of sellers, aided by Maricopa and Scottsdale. Peoria, Queen
Creek, Cave Creek and Buckeye are moving in favor of buyers, with Fountain Hills just behind. Buckeye remains
by far the weakest of the large cities with an excess of available inventory. Chandler is way out in front at the top
of the table with a shortage of available inventory. Paradise Valley managed a slight rise from last month.
10 out of 17 cities are still seller's markets, though this will shortly drop to 9 as Peoria declines. We have 3 cities
that are balanced and 4 are buyer's markets.
Current Market Commentary
Apr 8 - Fifteen years ago, 90% of the housing market talk was about foreclosures. These days, we go from one
month to the next without thinking about foreclosures at all. How times have changed!
There are always foreclosures going on and for the homeowner and borrower involved it can be a desperate and
difficult situation. It is not too great for the lender either.
But the number of foreclosures taking place this year is so low compared with 15 years ago that foreclosures have
almost no impact on the general housing market. It does not look like they will do in the medium term either.
Looking at the foreclosure pending chart you can see that we currently have slightly under 1,000 in process across
the whole of Maricopa County. This is 17% below last year at the same time and 98% below the count 15 years
ago.
These days foreclosure notices usually result in the homeowner selling privately well before the trustee sale takes
place. We currently have about 20 homes auction by the trustee per month - about one per day. Back in 2009 it
was not unusual to see 250 homes auctioned in a single day.
Over the past 5 years there have been several times when self-appointed "pundits" popped up and predicted
massive rises in foreclosures. All these "pundits" have been proven completely wrong.
Apr 6 - The affidavits of value have been counted and analyzed for Maricopa County's March filings and here is
what we found:
• There were 6,891 closed transactions, down 13% from 7,880 in March 2023 and but up 16% from February.
• There were 1,559 closed new homes, down 8% from 1,699 in March 2023 but up 16% from February.
• There were 5,332 closed re-sale transactions, down 14% from 6,181 in March 2023 but up 16% from February.
• The overall median sales price in March was $475,000, up 6.3% from March 2023 and up 1.7% from February.
• The re-sale median sales price was $459,000, up 7.0% from March 2023 and up 2.0% from February.
• The new home median sales price was $513,285, up 1.1% from March 2023 but down 0.6% from February.
Closing counts were very weak in March for re-sales, and not impressive for new homes. Pricing continued to
advance for re-sales but weakened a little for new homes, up only 1.1% from a year ago.
New homes took 22.6% market share. Three years ago, new homes were less than 15% of the total units sold.
These numbers are for single family and townhouse / condo homes.