
Market Statistics Report for April 18, 2024
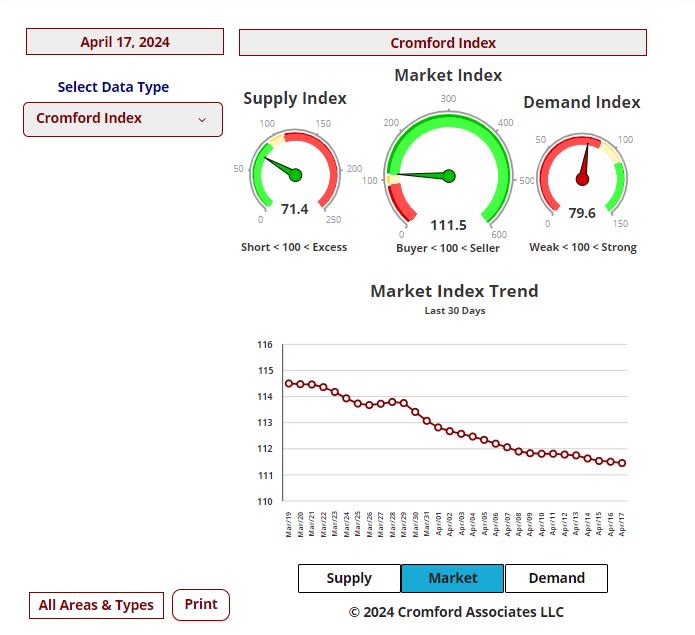
Market Dashboard – Cromford
recorded by ARMLS are included. Geographically, this includes Maricopa county, a large part of Pinal county and a small
part of Yavapai county. In addition, "out of area" listings recorded on ARMLS are included, although these usually
constitute a very small percentage of total sales and have very little effect on the data.
commercial units, and multiple dwelling units are also excluded.
Daily Market Snapshot – City Ranking
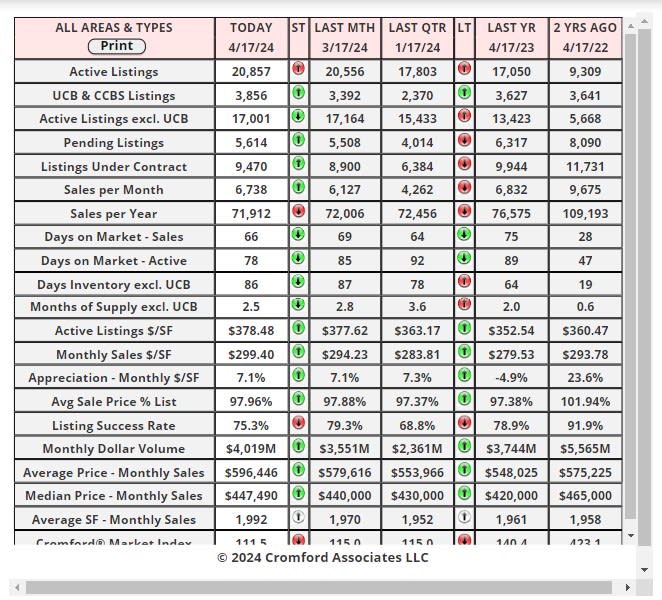
area. The figures shown are for the entire Arizona Regional area as defined by ARMLS. All residential resale transactions
recorded by ARMLS are included. Geographically, this includes Maricopa county, the majority of Pinal county and a small
part of Yavapai county. In addition, "out of area" listings recorded in ARMLS are included, although these constitute a very
small percentage (typically less than 1%) of total sales and have very little effect on the statistics.
Cromford Market Index
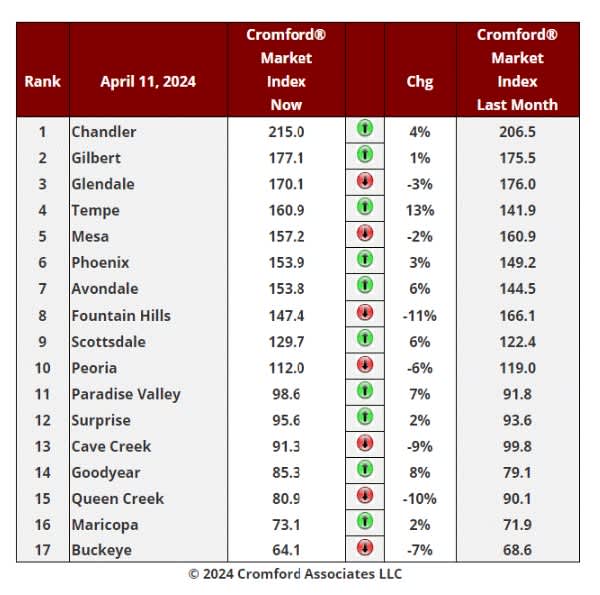
April 11 - Here is our latest table of Cromford® Market Index values for the single-family markets in the 17 largest
cities.
Cromford Market Index Commentary
The average change in CMI over the past month is +0.3%, up from zero last week. The picture is remarkably mixed
with some locations improving sharply for sellers over the last months and other deteriorating badly.
We have 10 cities showing an increase in their Cromford® Market Index over the past month, while 7 have declined.
This is the same as last week.
Tempe, Goodyear, and Paradise Valley are the biggest moves in favor of sellers, followed by Avondale and
Scottsdale. Fountain Hills, Queen Creek, Cave Creek and Buckeye are the primary locations moving in favor of
buyers, with Peoria just behind. Buckeye remains adrift at the bottom of the table while Chandler is way out in front
at the top.
10 out of 17 cities are seller's markets. We have 3 cities that are balanced, while 4 are buyer's markets. This mix
is unchanged from last week.
Dollar Volume by City
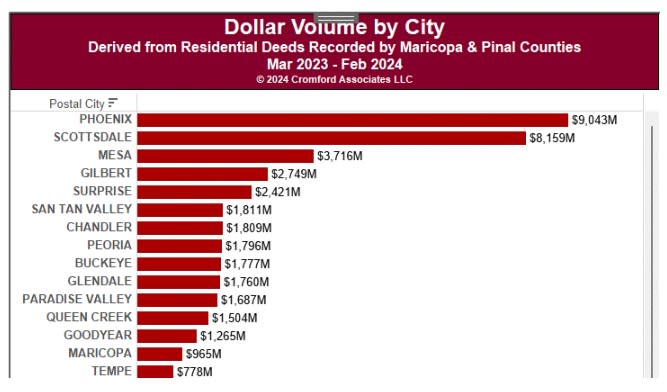
Apr 10 - From the Cromford® Public section we extracted this list of the top cities by Dollar Volume over the 12-
month period March 2023 - Feb 2024. It is noticeable how strong Scottsdale and Paradise Valley were over this
period. Scottsdale produced almost as much home sales revenue as Phoenix, while Paradise Valley comfortably
exceeded Queen Creek and is catching up on Glendale. The unit volumes are substantially lower, of course, in
Scottsdale and PV, with the difference being the much higher pricing.
However, the really interesting contrast is with 12 months earlier:
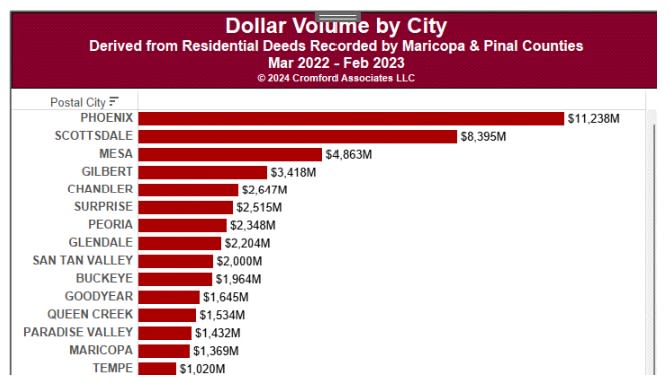
During March 2022 - Feb 2023, Scottsdale was substantially behind Phoenix and Paradise Valley ranked lower
than Queen Creek and far behind Glendale.
Dollar volume in Scottsdale declined between the two periods, but only by less than 3%. Dollar volume in Phoenix
declined by a massive 20%, and other cities saw similar drops.
Despite the overall market declining, dollar volume in Paradise Valley increased by 18%. Not only did the superluxury market remain very active in 2023, but pricing also increased dramatically, far more than in the rest of the
market.