
Market Statistics Report for April 2, 2024
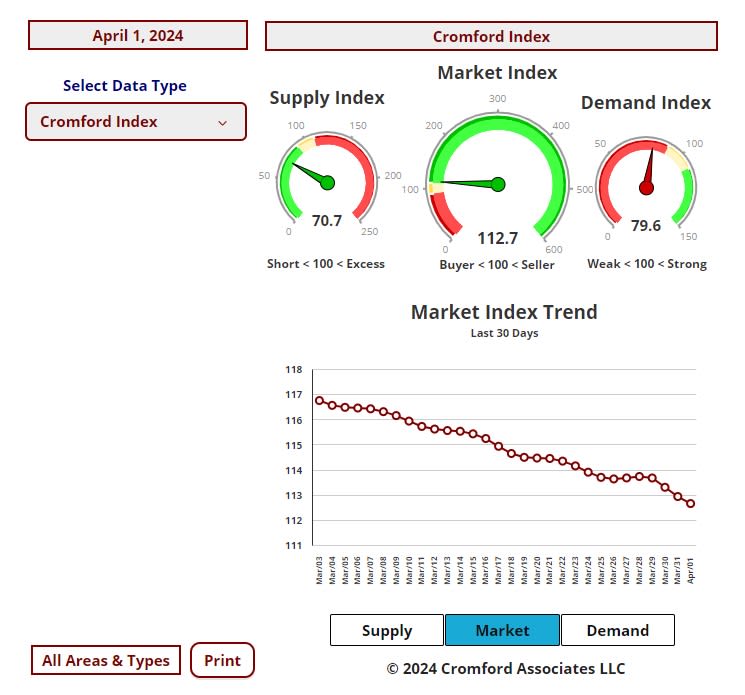
Market Dashboard – Cromford Index
All the statistics shown are for the entire Arizona Regional area as defined by ARMLS. All residential resale transactions
recorded by ARMLS are included. Geographically, this includes Maricopa county, a large part of Pinal county and a small
part of Yavapai county. In addition, "out of area" listings recorded on ARMLS are included, although these usually
constitute a very small percentage of total sales and have very little effect on the data.
commercial units, and multiple dwelling units are also excluded.
Daily Market Snapshot – City Ranking
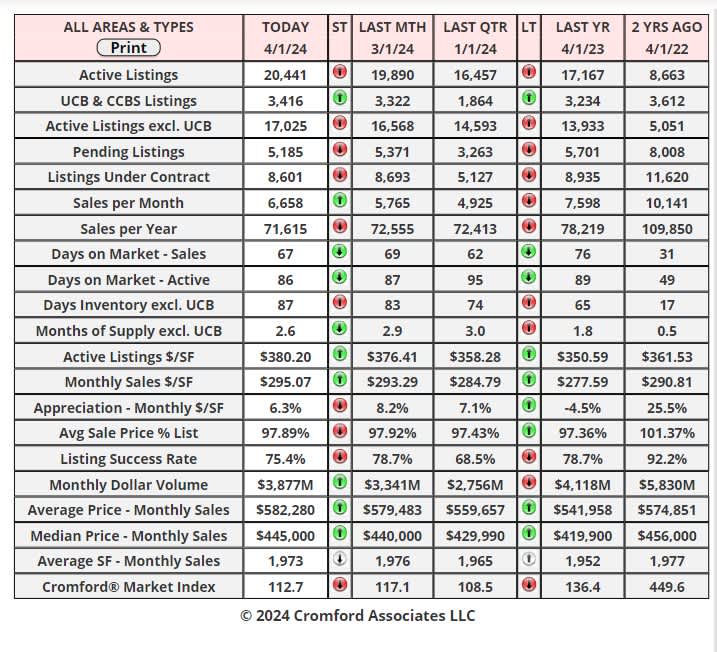
area. The figures shown are for the entire Arizona Regional area as defined by ARMLS. All residential resale transactions
recorded by ARMLS are included. Geographically, this includes Maricopa county, the majority of Pinal county and a small
part of Yavapai county. In addition, "out of area" listings recorded in ARMLS are included, although these constitute a very
small percentage (typically less than 1%) of total sales and have very little effect on the statistics.
Cromford Market Index
cities.
Cromford Market Index Commentary
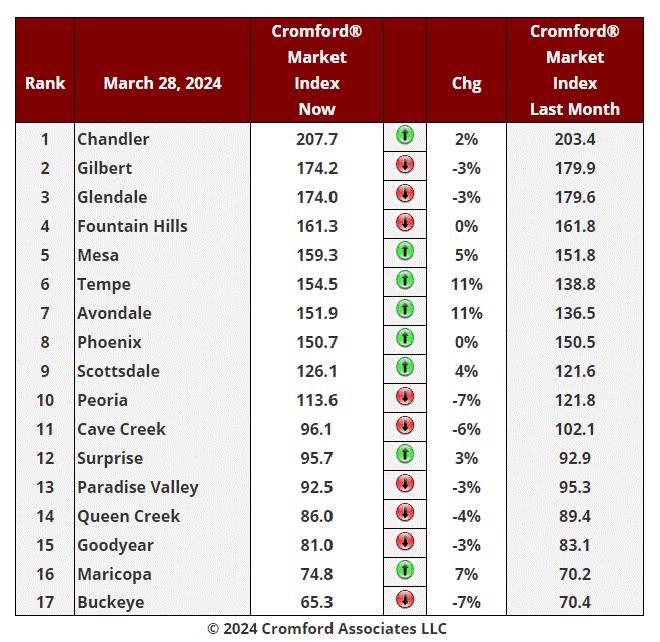
The average change in CMI over the past month is +0.4%, up from +0.1% last week.
We have 8 cities showing an increase in their Cromford® Market Index over the past month, while 9 have declined.
This is also slight improvement over last week. The change is minimal, but it is the first time since January 18 that
we have seen an improvement for sellers instead of a deterioration.
Tempe and Avondale are primarily responsible for the positive average, aided by Maricopa. Scottsdale is starting
to show a little momentum at +4%. Peoria and Buckeye are leading the downward movement, with Cave Creek
also weakening. Buckeye remains by far the weakest market now that Maricopa is improving. Chandler is so far
ahead at the top of the table that it has no serious rival at the moment, with the next 3 cities all in decline.
10 out of 17 cities are still seller's markets. We have 3 cities that are balanced and 4 are buyer's markets.
New Homes Year to Date
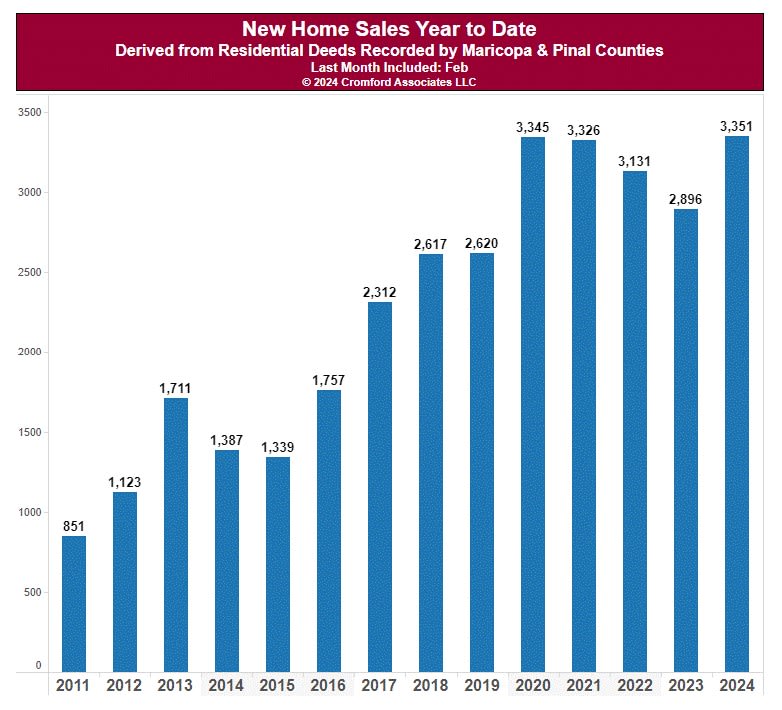
Apr 1 - Transaction volumes have been low for many months in the re-sale segment of the housing market.
However the same cannot be said of the new home segment.
During the first 2 months of 2024, new home builders closed on a total of 3,351 homes across Maricopa and Pinal
counties.
This is the highest total since 2006 and is up almost 16% from last year. New homes are taking a lot of the demand
away from re-sales. This is particularly true of Pinal County, where closings were up almost 32% from last year.
New home closings are up just over 10% in Maricopa County. Re-sale closings are down 0.4% compared to the
first 2 months of 2023.
New homes are very competitive on price. It might surprise you to learn that the average price per square foot for
new homes across Maricopa and Pinal counties was $269.75 in February 2024, which is far below the resale
average of $298.55. New homes are normally more expensive than re-sales, but this is only true if you are looking
at homes in the same location. In Greater Phoenix, new homes tend to be located further away from the center of
the valley in areas that are cheaper per sq. ft. because the land is cheaper out there.
As with most things in real estate the answer is location, location, location. The is the one thing you cannot change
about real property. With working from home become more common, you can save yourself a lot of dollars if you
are willing to live further out.
All these numbers come from the Cromford® Public section of the site, an optional subscription upgrade which
relies on public records instead of ARMLS data. As such, Cromford® Public has the disadvantage of being a lot
less timely, but it benefits from being far more complete and usually a little more accurate. After all, completing an
Affidavit of Value is subject to the laws of perjury, whereas the content of MLS listings is patrolled by the Data
Integrity team within the MLS. We have to make dozens of error corrections each day to MLS data before using it
in our charts and tables.3
The majority of new home sales do not touch the MLS, so we have to rely on public record data when analyzing
the new home market.