
Market Statistics Report for April 25, 2024
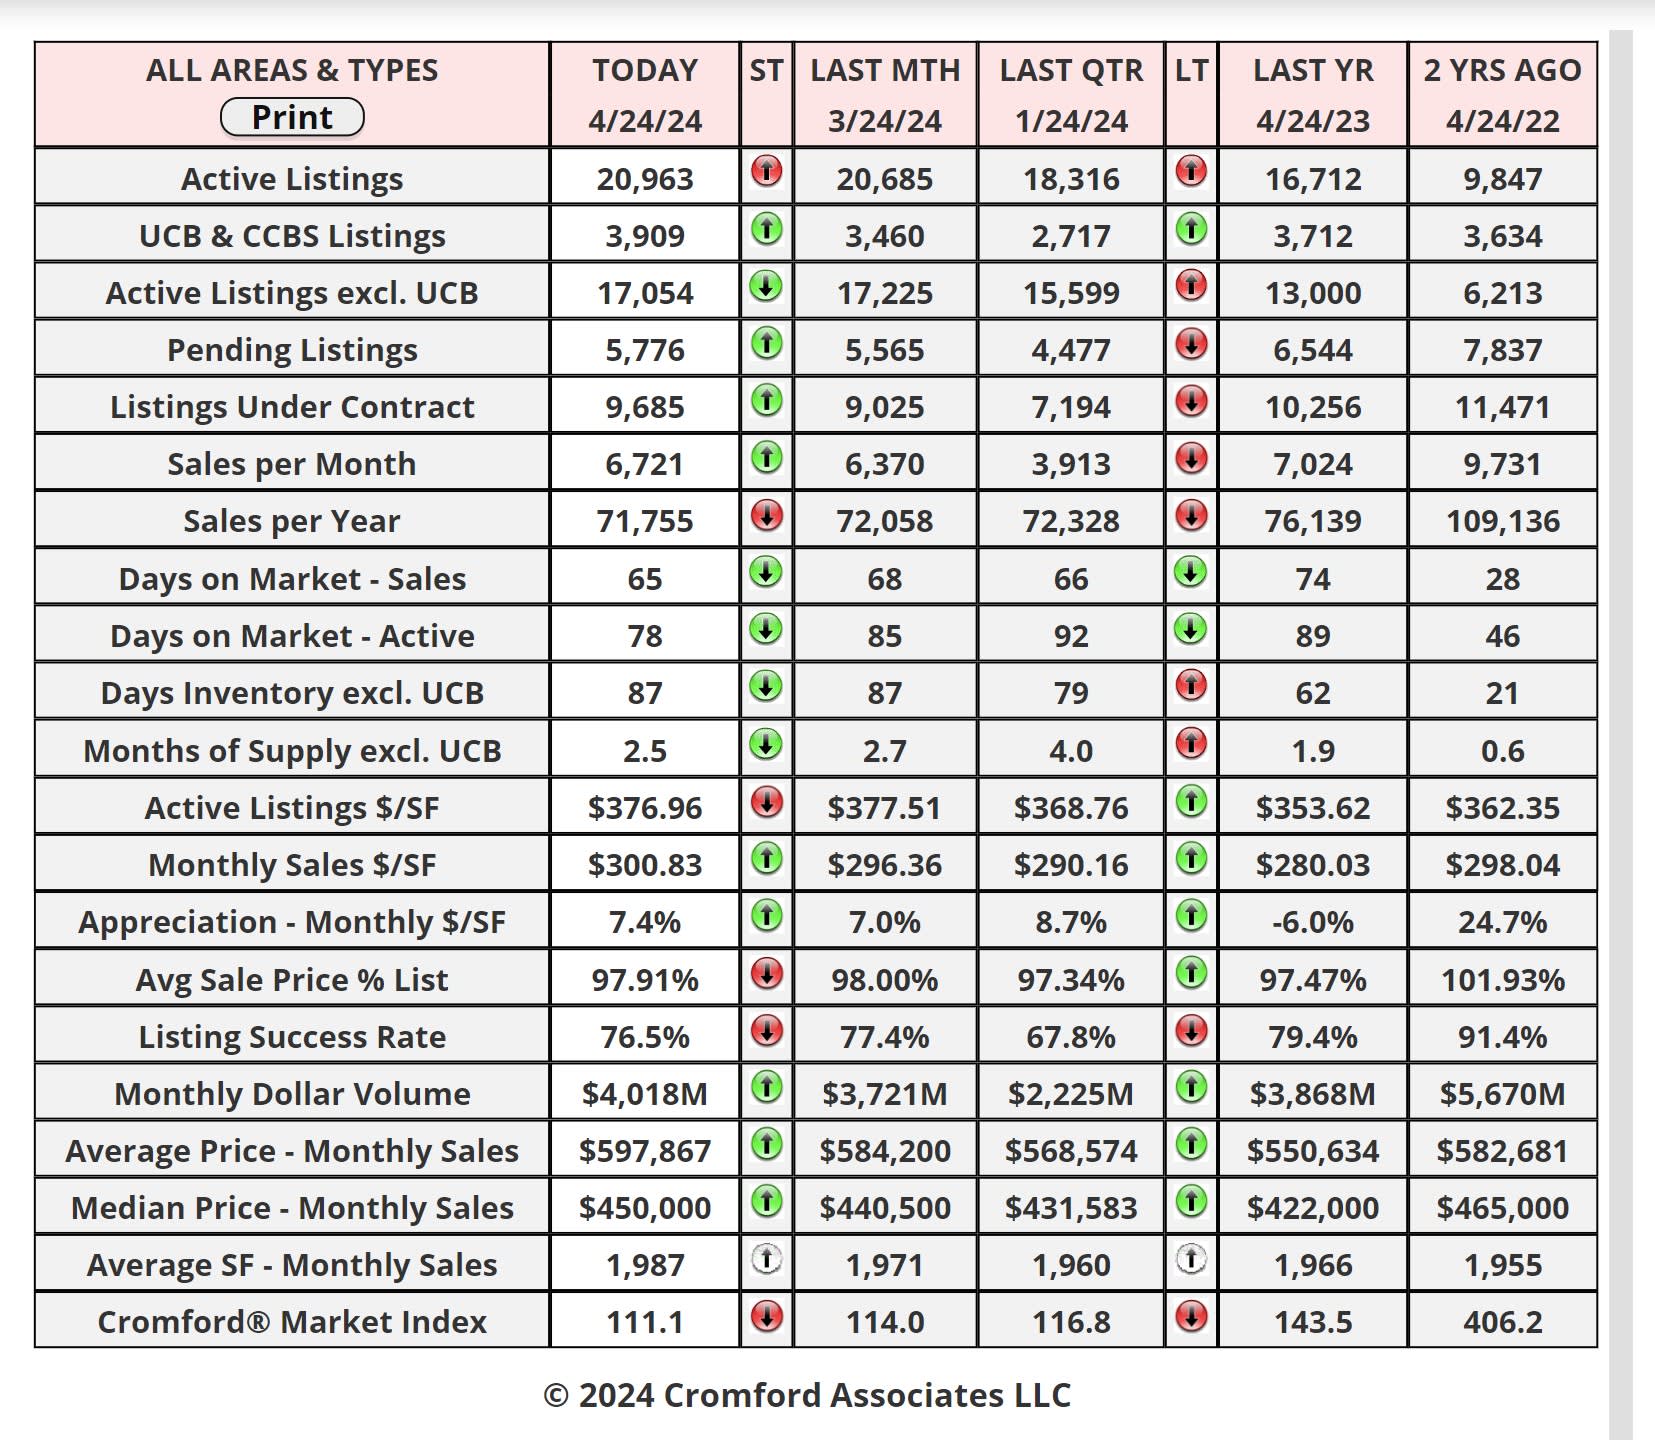
Market Dashboard – Average Price Per Sq Ft
All the statistics shown are for the entire Arizona Regional area as defined by ARMLS. All residential resale transactions
recorded by ARMLS are included. Geographically, this includes Maricopa county, a large part of Pinal county and a small
part of Yavapai county. In addition, "out of area" listings recorded on ARMLS are included, although these usually
constitute a very small percentage of total sales and have very little effect on the data.
All dwelling types are included. For-sale-by-owner, auctions and other non-MLS transactions are not included. Land,
commercial units, and multiple dwelling units are also excluded.

Daily Market Snapshot – City Ranking
area. The figures shown are for the entire Arizona Regional area as defined by ARMLS. All residential resale transactions
recorded by ARMLS are included. Geographically, this includes Maricopa county, the majority of Pinal county and a small
part of Yavapai county. In addition, "out of area" listings recorded in ARMLS are included, although these constitute a very
small percentage (typically less than 1%) of total sales and have very little effect on the statistics.
Cromford Market Index
cities.
Cromford Market Index Commentary
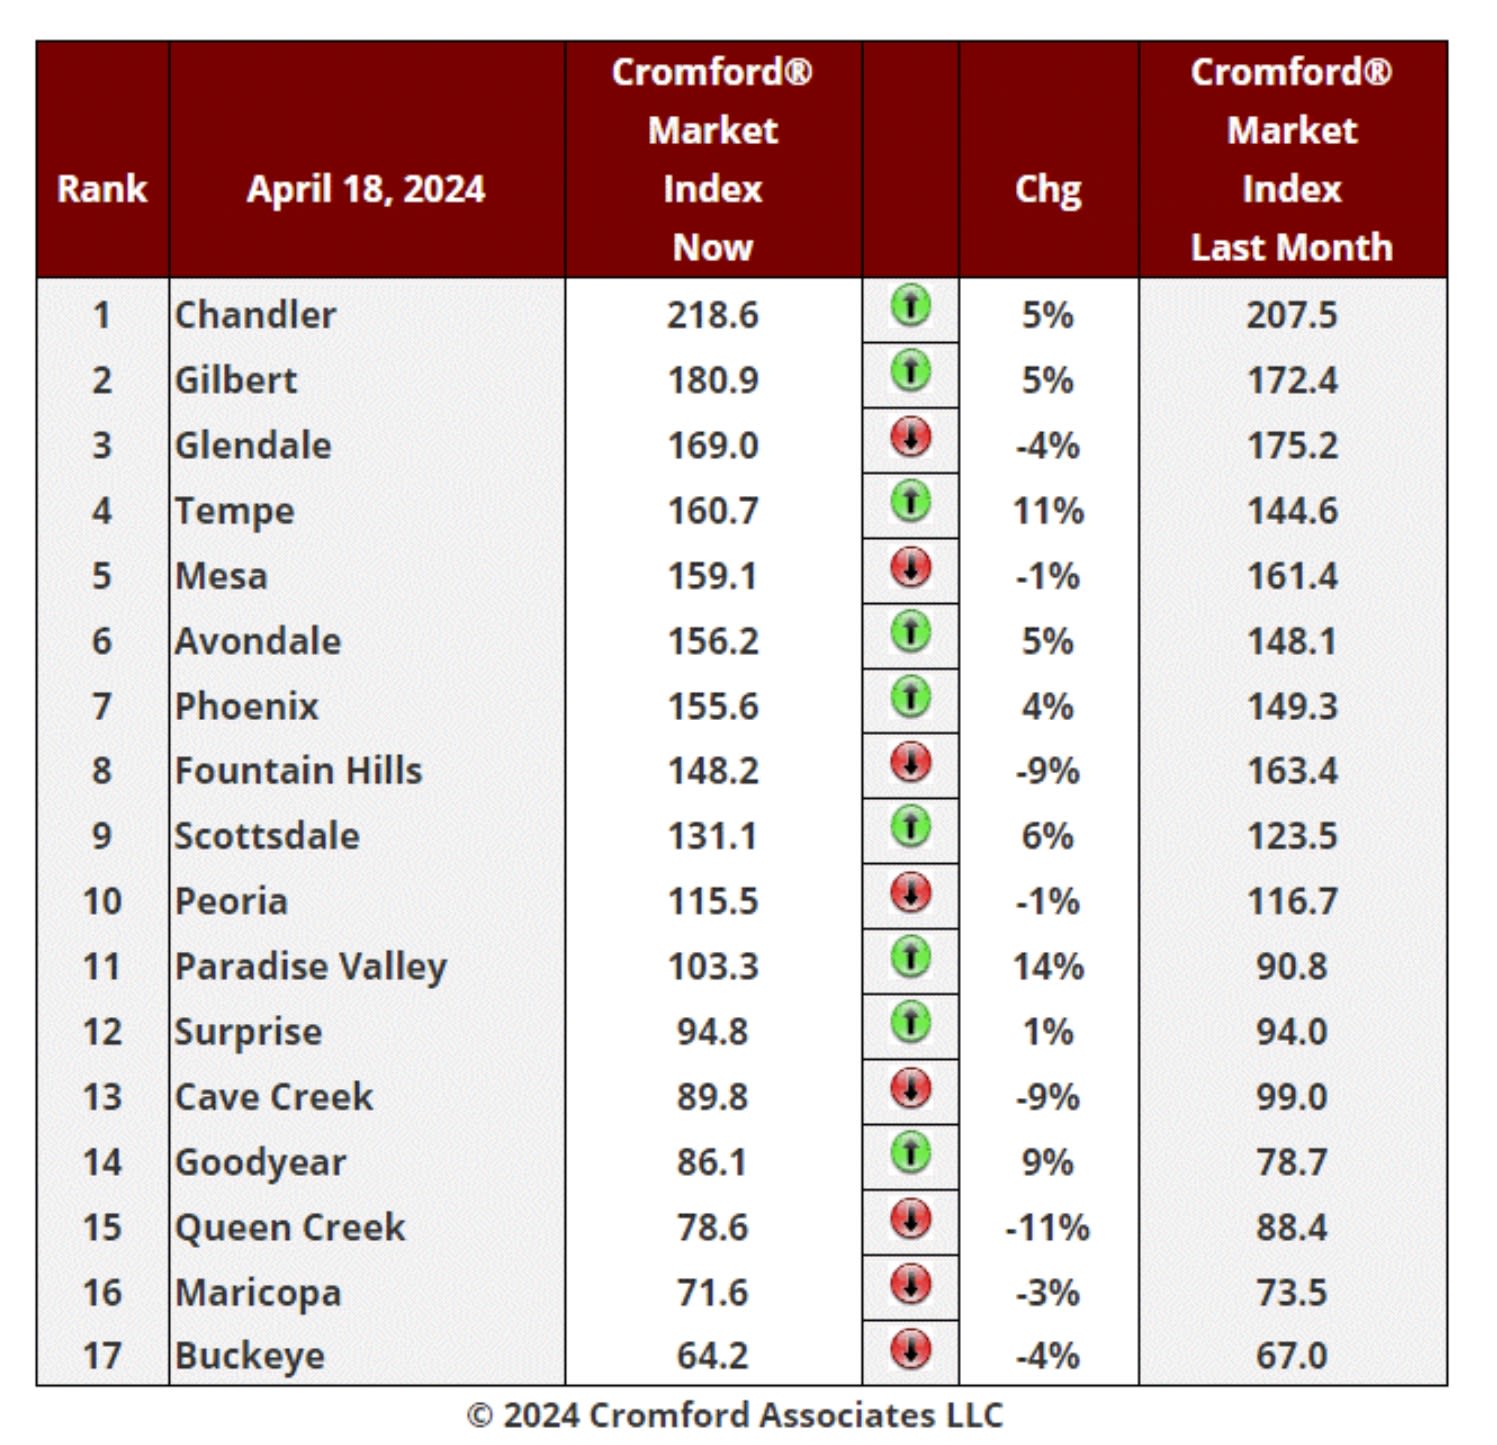
The average change in CMI over the past month is +1.1%, up from +0.3% last week.
We have 9 cities showing an increase in their Cromford® Market Index over the past month, while 8 have declined.
This is worse than last week. Mixed signals again.
Tempe, Goodyear, and Paradise Valley are the biggest moves in favor of sellers, followed by Scottsdale. Fountain
Hills, Queen Creek, Cave Creek are the primary locations moving in favor of buyers. Buckeye remains adrift at the
bottom of the table while Chandler is still way out in front at the top. Gilbert is attempting to challenge Chandler
while Queen Creek has joined Maricopa below the 80 level.
10 out of 17 cities are seller's markets. We have 2 cities that are balanced, while 5 are buyer's markets. This mix
is weaker than last week thanks to Cave Creek moving from balanced to a buyer's market.
Single Family Building Permits Commentary
Apr 24 - Single-family building permits are still running far ahead of last year and the total of 8,334 for the first
quarter of 2024 across Maricopa and Pinal was the highest quarterly number since Q1 2022.
The top 10 locations for new permits during the first quarter of 2024 were:
1. Phoenix (1,250)
2. Surprise (1,005)
3. Unincorporated Pinal County (993)
4. Unincorporated Maricopa County (669)
5. Buckeye (583)
6. Peoria (572)
7. Queen Creek (540)
8. Goodyear (540)
9. Maricopa (333)
10. Mesa (291)
Peoria showed the largest growth over last year, when there were only 54.
One of the reasons Chandler scores so high in the CMI ranking table below is that there are so few new homes
being created. Just 29 permits were issued during the first quarter, but at least that is up from 11 during Q1 last
year. Gilbert only gave us 72, down from 123 in 2023 and Tempe saw only 25.
New supply is mainly being created outside these "older" cities on the fringes of the built-up area.
Average Price Per Square Foot Commentary
Apr 21 - The average price per square foot for all areas & types has breached the $300 level again.
The record stands at $306.39, set on June 10, 2022. This was followed by a 14% correction down to a low of
$263.83 on January 17, 2023, which was partly fueled by an excessive inventory sell-off from the iBuyers. Since
January 2023, prices have been generally moving higher. We were at $279.86 one year ago and prices have risen
7.3% over the last 12 months.
They would only have to rise by 2% to establish a new all-time high.