
Market Statistics Report for August 10, 2024
Market Dashboard – Dashboard
This Dashboard provides a comprehensive summary of the current state of the overall residential resale market.
All the statistics shown are for the entire Arizona Regional area as defined by ARMLS. All residential resale transactions
recorded by ARMLS are included. Geographically, this includes Maricopa County, a large part of Pinal county and a small
part of Yavapai county. In addition, "out of area" listings recorded on ARMLS are included, although these usually
constitute a very small percentage of total sales and have very little effect on the data.
All dwelling types are included. For-sale-by-owner, auctions and other non-MLS transactions are not included. Land,
commercial units, and multiple dwelling units are also excluded.
Daily Market Snapshot
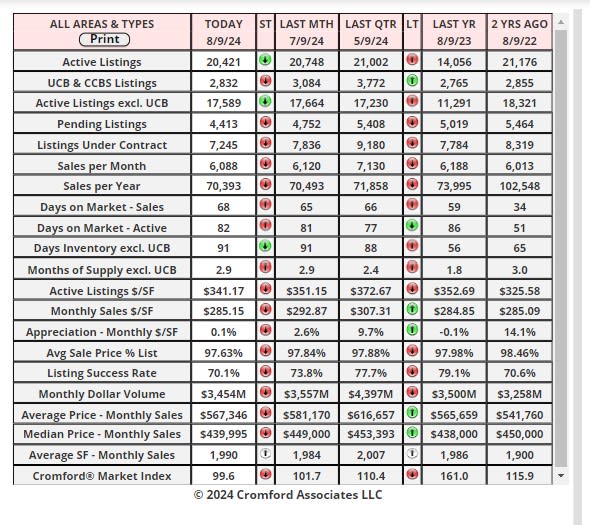
The table below provides a concise statistical summary of today's residential resale market in the Phoenix metropolitan
area. The figures shown are for the entire Arizona Regional area as defined by ARMLS. All residential resale transactions
recorded by ARMLS are included. Geographically, this includes Maricopa county, the majority of Pinal county and a small
part of Yavapai county. In addition, "out of area" listings recorded in ARMLS are included, although these constitute a very
small percentage (typically less than 1%) of total sales and have very little effect on the statistics.
Cromford Market Index
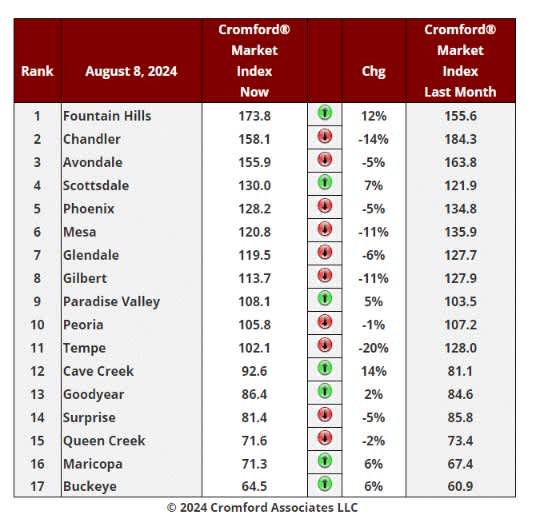
Aug 8 - Here is our latest table of Cromford® Market Index values for the single-family markets in the 17 largest
cities.
Cromford Market Index Commentary
This table is starting to look a lot less negative. We have 7 cities showing an increase in their Cromford® Market
Index over the past month, up from 5 last week.
The average change in CMI over the past month is -1.8%, a much smaller decline than the -4.4% we saw last week
and continuing the positive trend that started three weeks ago. If we look at the change over the past week, we see
an average of +0.4%. That's right - the average CMI went up slightly from August 1 to August 8.
Fountain Hills, Cave Creek, Scottsdale are showing the largest percentage gains, so it seems clear that the top
end of the market is leading the resistance against the weaker market. Maricopa, Buckeye, Goodyear and Paradise
Valley are all up over the last month. The largest declines are still concentrated in the Southeast Valley (Tempe,
Gilbert, Chandler and Mesa). After a long stay at the top, Chandler has weakened dramatically and looks likely to
be overtaken by Avondale and fall into third place.
8 out of 17 cities remain seller's markets over 110. We have 4 cities that are balanced, while the remaining 5 are
buyer's markets. 3 cities still remain over 140 and Scottsdale is making an attempt to join them.
New Contracts vs Back on Market – Greater Phoenix Area
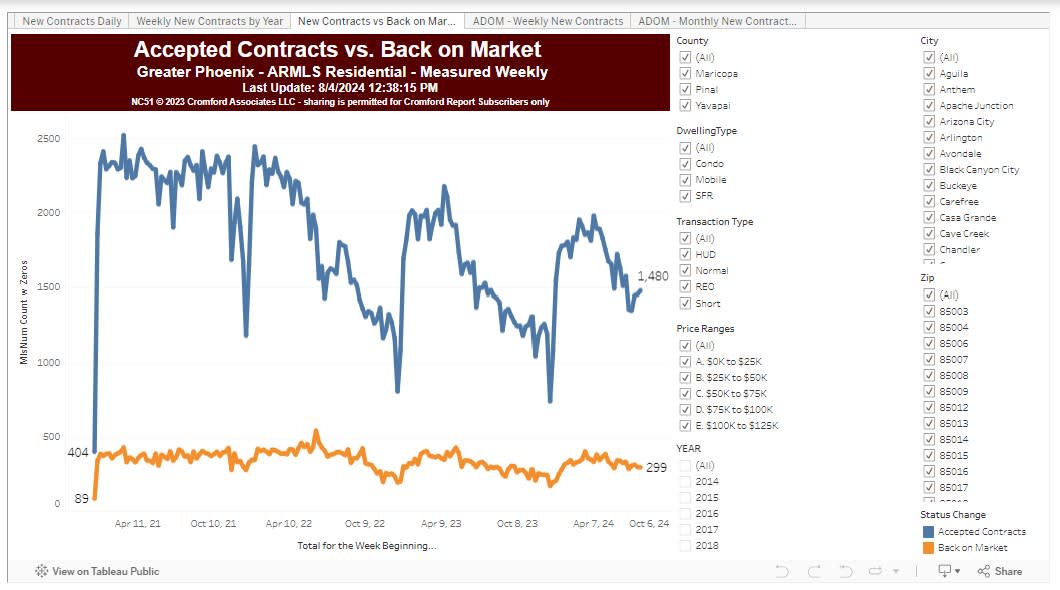
The latest number is 36 which is up sharply from 20 just 12 months ago. In fact, it is the highest reading for August
since 2014, which was a particularly weak period for housing. This means listings are taking longer to get a contract
accepted than in any August in the last 10 years. This may well match your current experience as an agent.
This measure tends to be influenced by seasonality with December and January producing high values, which need
to be treated with caution.
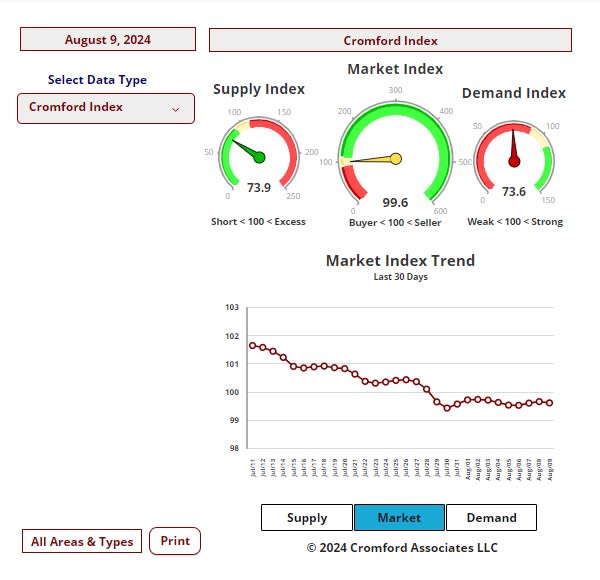
When supply and demand are in balance, the CMI is around 100, but this happens much less than you might think.
Over the past 24 years, we have tended to be mostly in a seller’s market and when we are not, we often have a
buyer’s market. In buyer’s markets DOM values get very high, even well into the hundreds of days. Since we are
rarely in a balanced market, sellers experiencing them tend to think they are worse than balanced, because they
feel “worse than normal”. They ARE worse than normal because a normal market is unbalanced in favor of sellers.
Balance and normal are not the same thing.
The last time we had a CMI below 100 was 4Q 2022. Average DOM for closed listings was then between 51 and
68. Today we are at 67, so in the same ballpark.
DOM for active listings is always much higher than DOM for closed listings because the active listings contain a
higher percentage of luxury homes than the closed listings. These luxury homes spend much longer in active status
and distort the reading to the upside.
Currently, I think a lot of buyers are in limbo, waiting for mortgage rates to fall further, as that is what all the media
pundits are saying will happen later this year.
Monthly Affidavits of Value
Aug 3 - The affidavits of value have been counted and analyzed for Maricopa County's July filings and here is what
we found:
• There were 6,360 closed transactions, up 4.6% from 6,081 in July 2023 but down 4.1% from June.
• There were 1,378 closed new homes, up 1.9% from 1,352 in July 2023 but down 13% from June.
• There were 4,982 closed re-sale transactions, up 5.4% from 4,729 in July 2023 but down 1.3% from June.
• The overall median sales price in June was $467,545, up 0.5% from July 2023 but down 1.6% from June..
• The re-sale median sales price was $450,000, up 1.1% from July 2023 but down 3.2% from June.
• The new home median sales price was $506,240, down 5.1% from July 2023 but up 0.5% from June.
There were 22 working days in July 24 versus 21 in July 23, so the 4.6% rise in closings is more than explained by
the 4.8% increase in the number of working days. In a reversal of long-standing trends, new homes grew only 1.9%,
while resales grew 5.4%, modestly exceeding the change in working days.
New home market share dropped to 21.7% in July 2024, down from 22.2% a year ago.
Prices were weak for re-sales, down more than 3% from a month earlier. The peak remains $486,000 achieved in
May 2022, just before the iBuyers started their liquidation sales.
Overall, we see an annual rise in the median sales price of only 0.5%, so well below the rate of inflation. This means
the median home is cheaper than a year ago, when adjusted for inflation. The median new home is down more
than 5% from a year ago, so cheaper than last year even before adjusting for inflation.
Given that median household incomes have risen substantially over the last year, affordability in Maricopa County
has improved, though there is no sign yet of this leading to strengthening demand. It would make sense to assume
that potential buyers are waiting for mortgage rates to come down. Recent pronouncements by the Federal Reserve
suggest such a change is on the cards in the short-term.
These numbers are for single family and townhouse / condo homes.