
Market Statistics Report for August 18, 2024
Market Dashboard – Dashboard
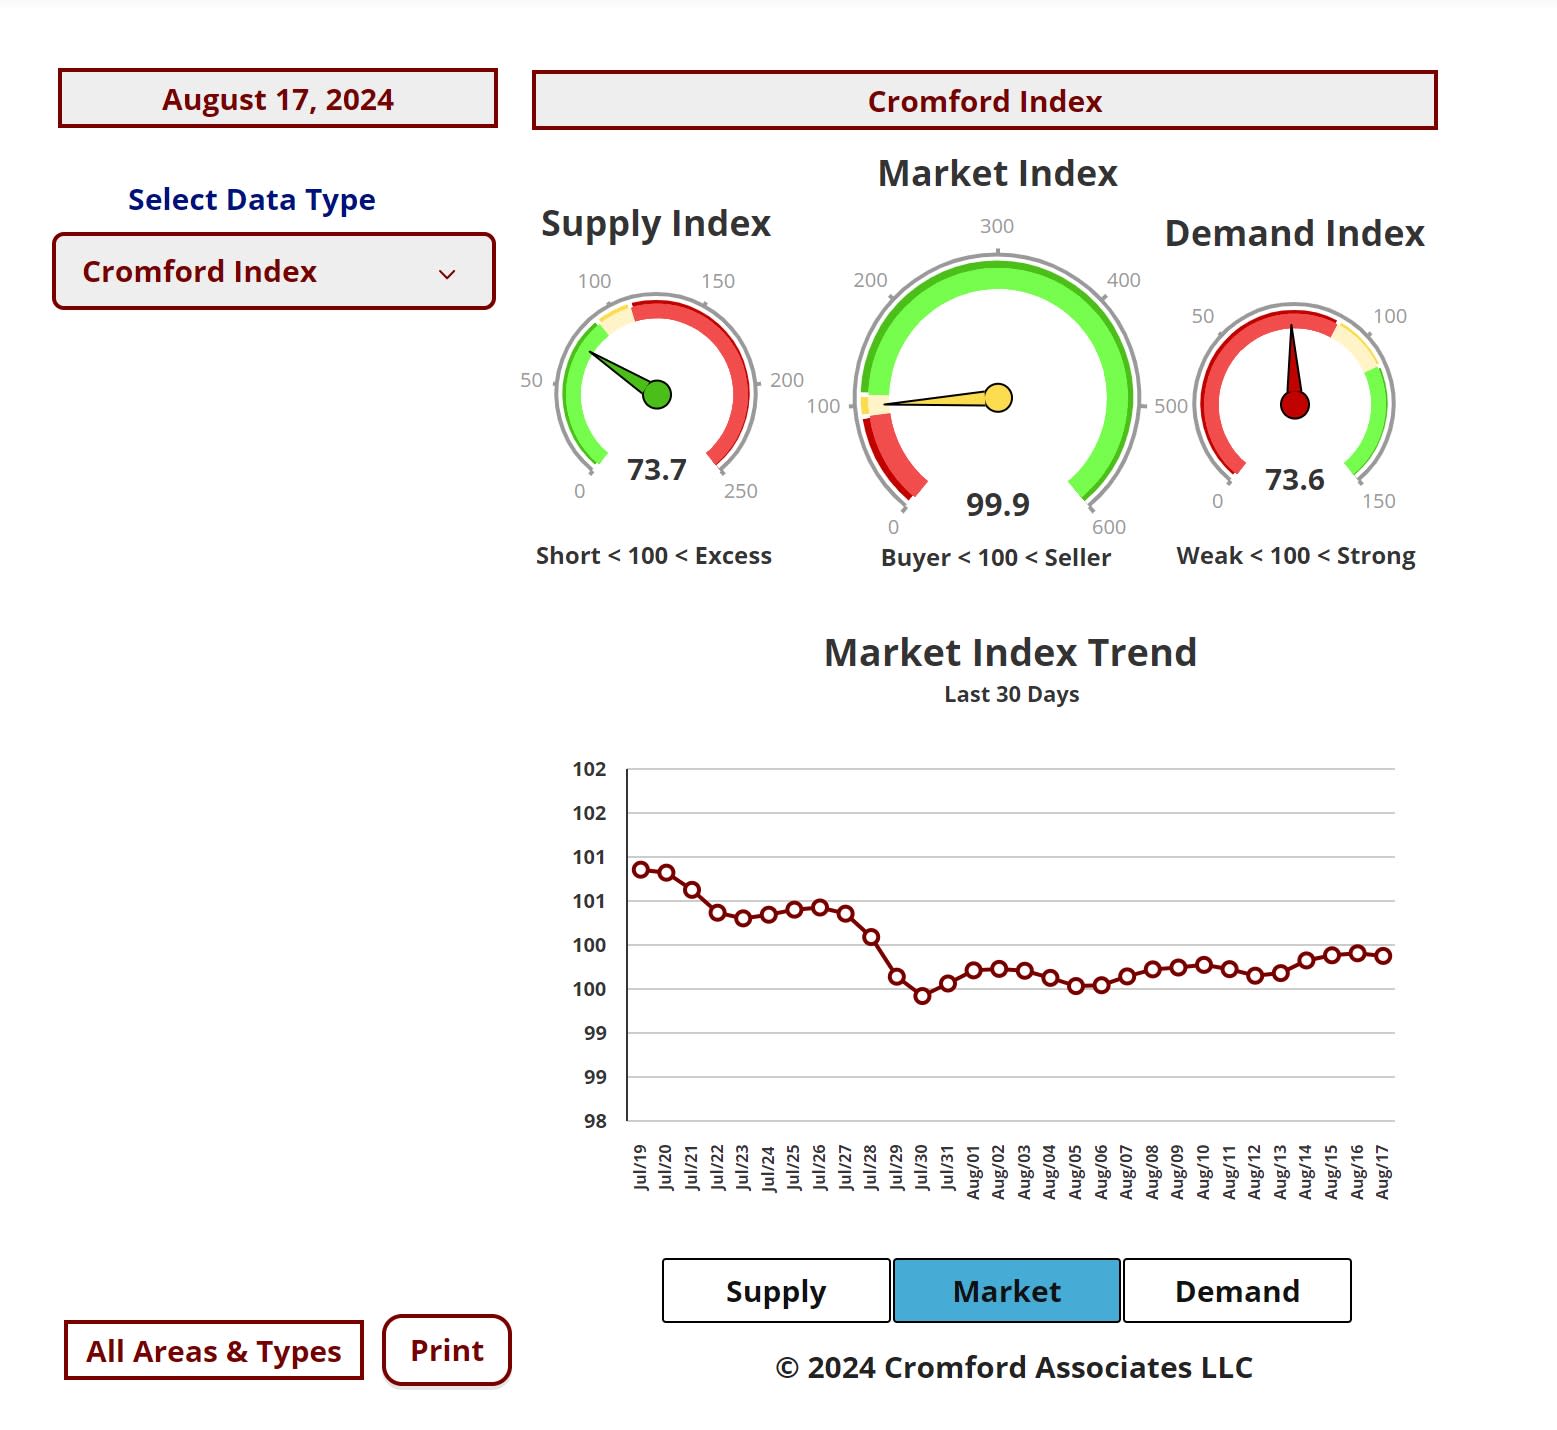
This Dashboard provides a comprehensive summary of the current state of the overall residential resale market.
All the statistics shown are for the entire Arizona Regional area as defined by ARMLS. All residential resale transactions
recorded by ARMLS are included. Geographically, this includes Maricopa County, a large part of Pinal county and a small
part of Yavapai county. In addition, "out of area" listings recorded on ARMLS are included, although these usually
constitute a very small percentage of total sales and have very little effect on the data.
All dwelling types are included. For-sale-by-owner, auctions and other non-MLS transactions are not included. Land,
commercial units, and multiple dwelling units are also excluded.
Daily Market Snapshot
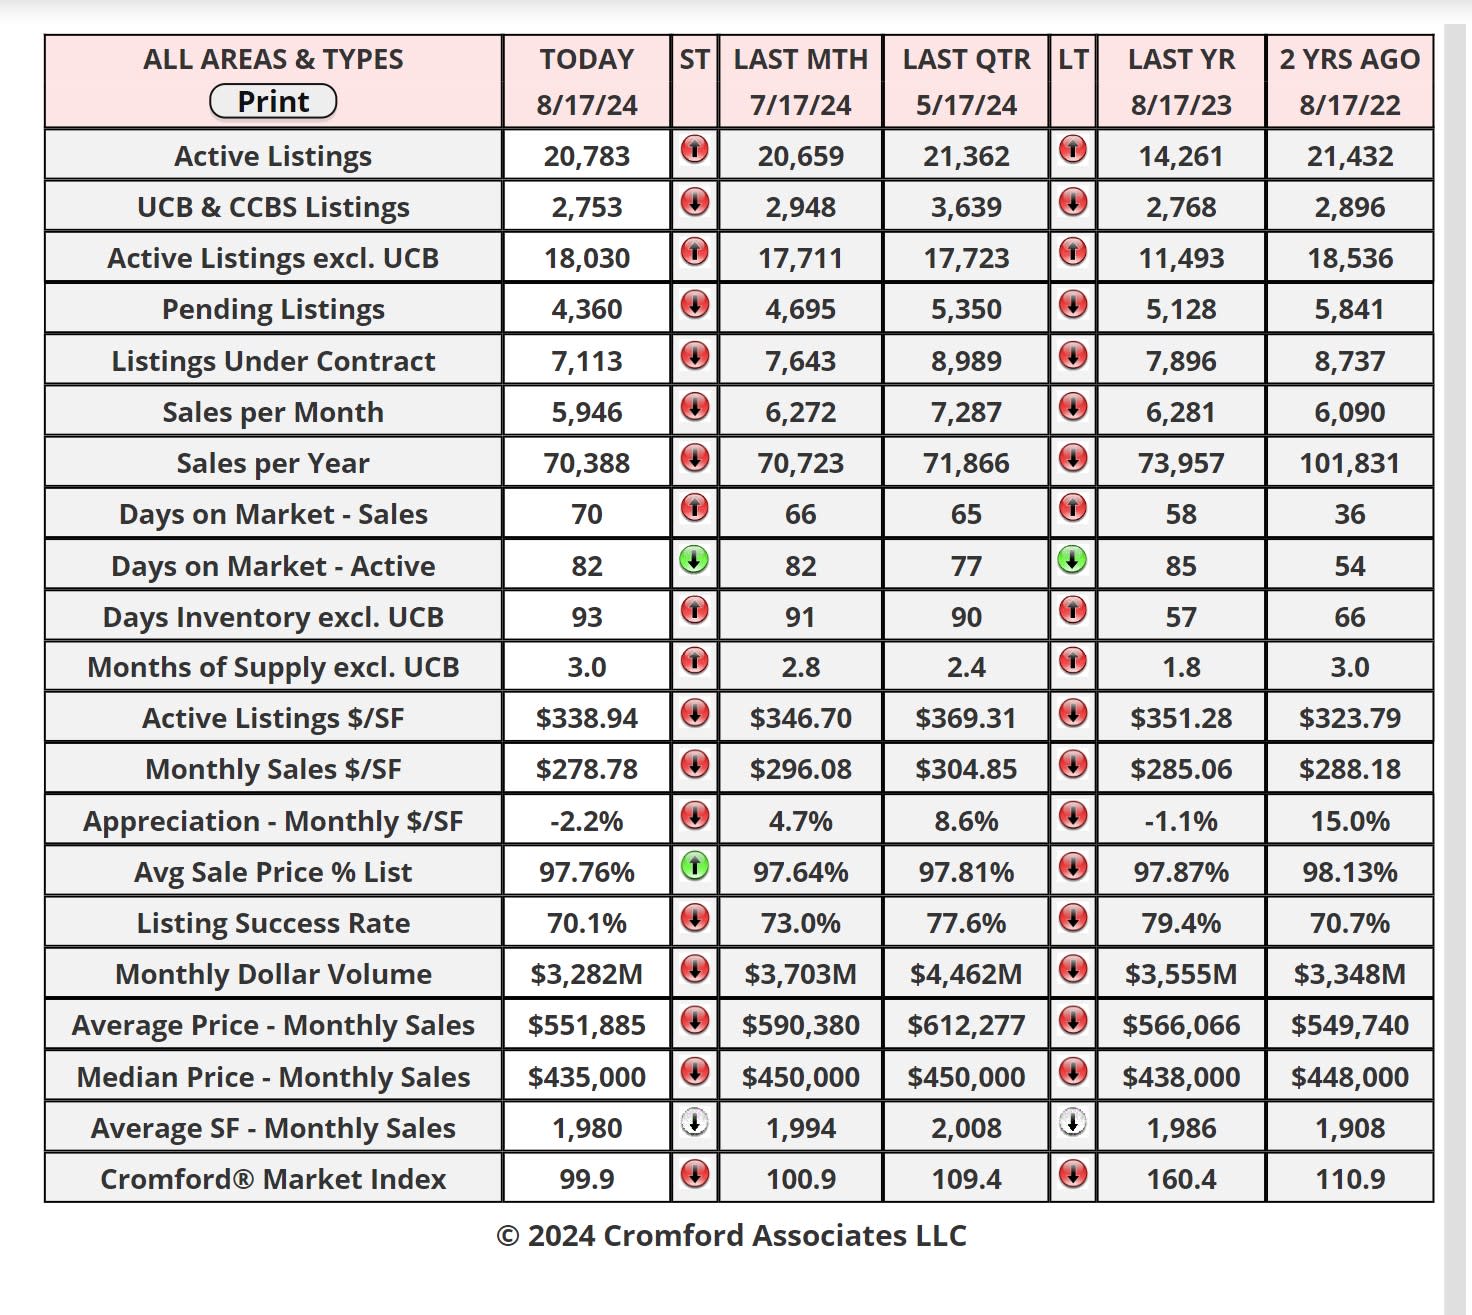
The table below provides a concise statistical summary of today's residential resale market in the Phoenix metropolitan
area. The figures shown are for the entire Arizona Regional area as defined by ARMLS. All residential resale transactions
recorded by ARMLS are included. Geographically, this includes Maricopa county, the majority of Pinal county and a small
part of Yavapai county. In addition, "out of area" listings recorded in ARMLS are included, although these constitute a very
small percentage (typically less than 1%) of total sales and have very little effect on the statistics.
Cromford Market Index
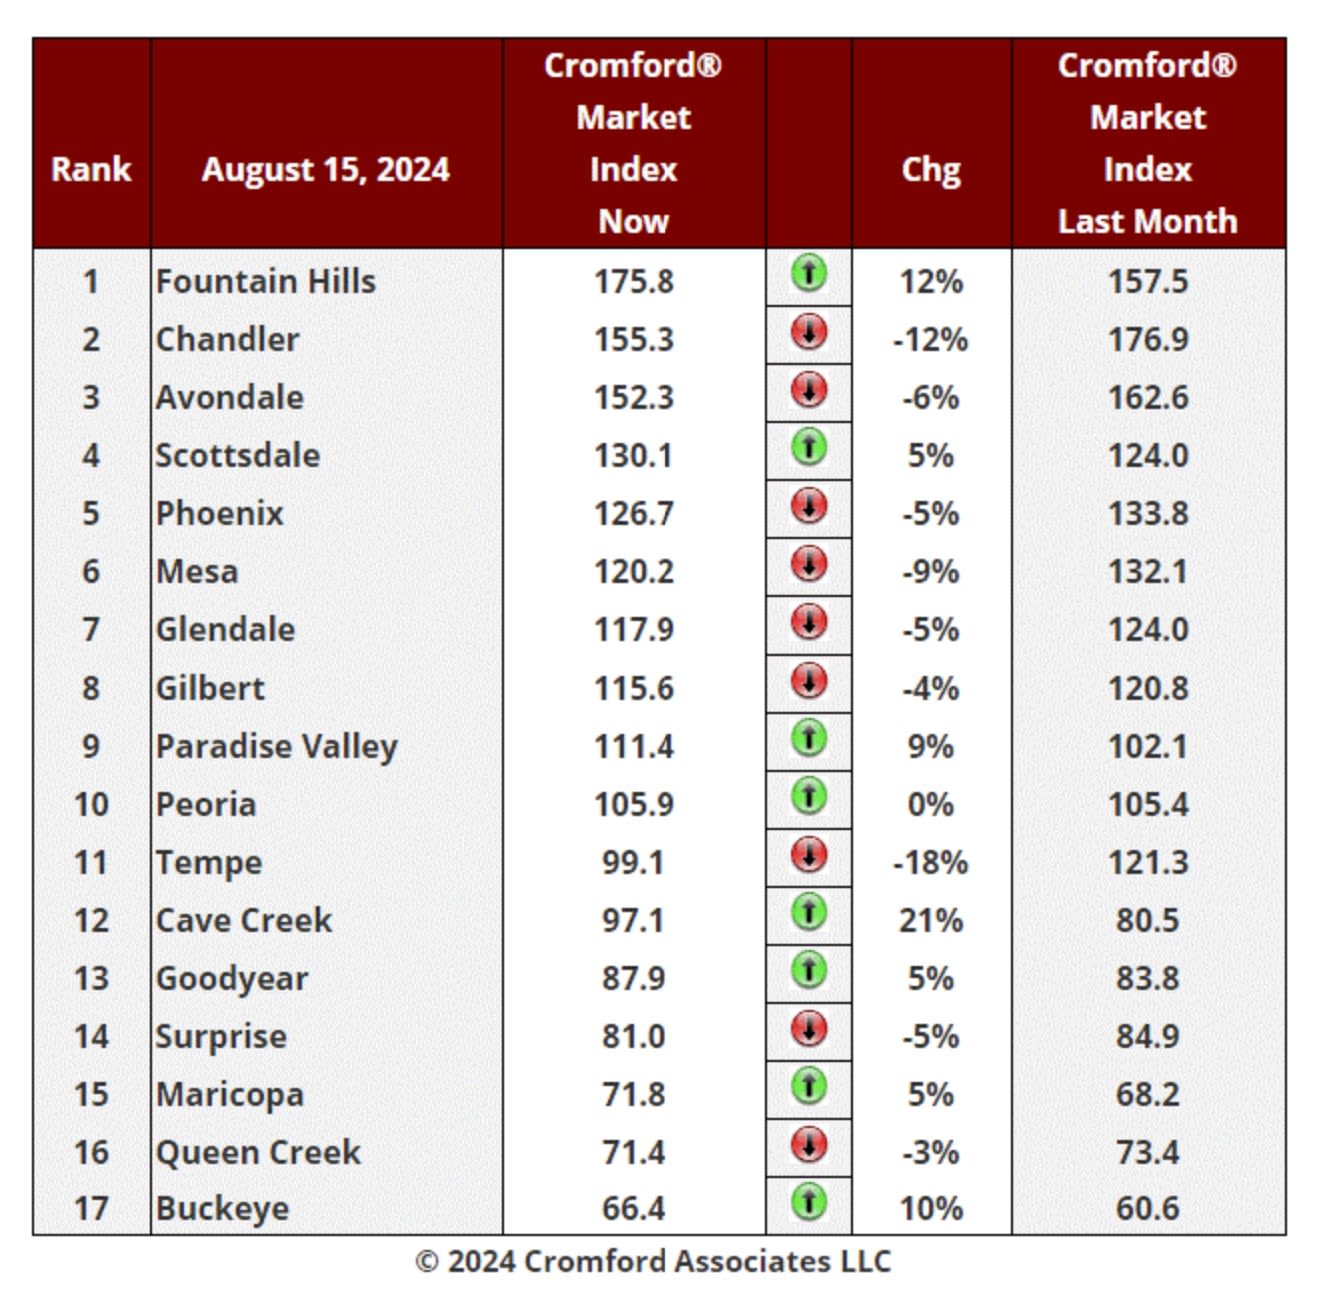
Aug 15 - Here is our latest table of Cromford® Market Index values for the single-family markets in the 17 largest
cities.
Cromford Market Index Commentary
This table is once again looking less negative than the week before. We have 8 cities showing an increase in their
Cromford® Market Index over the past month, up from 7 last week. We have 9 cities showing a decrease.
However, the change is painfully slow and this makes it a frustrating time for market watchers.
The average change in CMI over the past month is -0.1%, a much smaller decline than the -1.8% we saw last week
and continuing a positive trend that started four weeks ago. This means we are on the cusp of seeing the market
start to improve for sellers overall.
Fountain Hills, Cave Creek, Buckeye and Paradise Valley are showing the largest percentage gains. In addition,
Scottsdale, Maricopa, Goodyear and Peoria are all up over the last month, only by a tiny bit in the latter case. The
largest declines are still concentrated in the Southeast Valley (Tempe, Chandler and Mesa).
9 out of 17 cities remain seller's markets over 110. We have 3 cities that are balanced, while the remaining 5 are
buyer's markets. 3 cities still remain over 140 while 3 remain under 75.
Things have stopped getting worse and maybe about to improve. However, there is little sign of excitement and a
lot of waiting for something significant to happen.
High End Market Commentary
Aug 17 - We have mentioned many times that the high-end market tends to drop off substantially during the summer
months, causing all sorts of distortion in market averages, especially those related to price.
To illustrate how this happens, let us look at the figures for April versus July and compare the Northeast Valley with
the rest of the Greater Phoenix market. We know that the bulk of luxury homes are situated in the Northeast Valley,
which we will define as Carefree, Cave Creek, Fort McDowell, Fountain Hills, Paradise Valley, Rio Verde and
Scottsdale. We are going to add Phoenix 85016 and 85018 and exclude Scottsdale 85257.
For this area the April single-family detached sales count was 662 and the July count was 440. This represents a
unit volume decline of almost 34%. The average price per square foot also fell from $558.56 to $505.70, a decline
of 9.5%.
For the rest of Greater Phoenix excluding the area defined above, the single-family detached sales count for April
was 4,631 and the average $/SF was $262.36. In July the sales count was 4,267 and the $/SF was $254.26. So,
the sales declined only 8% and the $/SF only went down by 3%.
When we look at Greater Phoenix as a whole, we see the weak contribution from luxury sales dragging down the
$/SF all the way from $313.17 to $289.28, a drop of 7.6%, more than twice the decline seen in the market outside
the Northeast.
Naturally we expect high-end sales to recover once the temperatures cool off, which will mean their contribution to
the average $/sf will grow and average pricing will probably recover its stability.
August 2024 - Infographic JPG | Infographic and Commentary PDF
Mortgage Rates Drop Again - Homes are 10% Off
Record Share of Sellers Paying Buyers’ Fees
For Buyers:
On August 5th, everything went on sale in the housing industry. As discussed in last month’s edition, multiple
factors are pointing towards improvements in mortgage rates this year. Well, it happened faster than many were
expecting at the beginning of August as average mortgage rates dropped abruptly to 6.3% before settling at 6.5%,
a significant improvement from last April’s average rate of 7.5%. The net result for buyers was a 10%-11% drop in
the principal and interest payments regardless of loan amount. Loans between $300K-$400K saw calculated
payments drop from $200-$270 per month, while those between $450K-$550K saw drops between $300-$370 per
month.
The drop spurred an immediate 16% increase in refinance applications week over week, per the Mortgage Bankers
Association, as homeowners who decided to buy and “date” their 7%-8% rate over the past year started thinking
about a breakup. Purchase applications also increased, but by just 1%. This is not unusual because when mortgage
rates make big strides down, the first response by buyers is to wait and see if they decline further. Once rates
stabilize under 6.5% for a little while, more demand may materialize.
In the meantime, a record share of sellers are paying for their buyers’ closing fees. So far in August, 55% of sellers
agreed to concessions, with half of them paying out $9,800 or more. Even as mortgage rates decline, tools such
as the 2/1 buy-down are still the norm. Temporary 2/1 buy downs are contributions by the seller used to supplement
10%-20% of the buyer’s payments for 2 years. They typically cost around 2.3% of the loan amount.
On a $400,000 loan, the rate change of 7.5% to 6.5% from April to August drops the monthly principal and interest
payment from $2,797 to $2,528, saving a buyer $269 per month. Combined with a 2/1 buy down courtesy of the
seller, the buyer pays the equivalent of 4.5%, instead of 5.5%, for the first year, dropping the PI payment to $2,027,
saving an additional $501 per month. That’s a total of $770 in monthly savings to the buyer as a result of the recent
rate change this month and more than half of sales with seller-paid incentives.
For Sellers:
As mortgage rates hopefully continue to improve gradually with emerging economic data, sellers will still need to
drum up all of their available patience when listing their home. Buyers don’t move nearly as fast as the stock market
does when the Federal Reserve speaks, or employment reports are released. While all eyeballs are on the demand
line to see if it moves higher, buyers still must fill out applications, submit paperwork, and get moving. Meanwhile,
half of sellers who accepted contracts so far this month were on the market for 37 days or longer before they tasted
success.
The good news is that the demand index, seasonally adjusted, has stopped declining since the rate drop and
there’s little movement towards a buyer’s market at this time. Greater Phoenix remains in a balanced state. The
bad news is prices are stagnate, rising only 1.9% from this time last year. While it’s tempting to test and push the
market to achieve the highest price possible, the consequence for that strategy could be longer time on the market
and multiple price cuts, which are up 67% compared to last year.
Managing expectations is key to a positive selling experience. Balanced market conditions cannot meet the high
seller expectations of a seller’s market. Listings typically require more work and a solid strategy, even if they’re in
perfect condition. At a time when real estate professionals are experiencing intense scrutiny and change, this is
the market where they are needed the most.