
Market Statistics Report for August 28, 2024
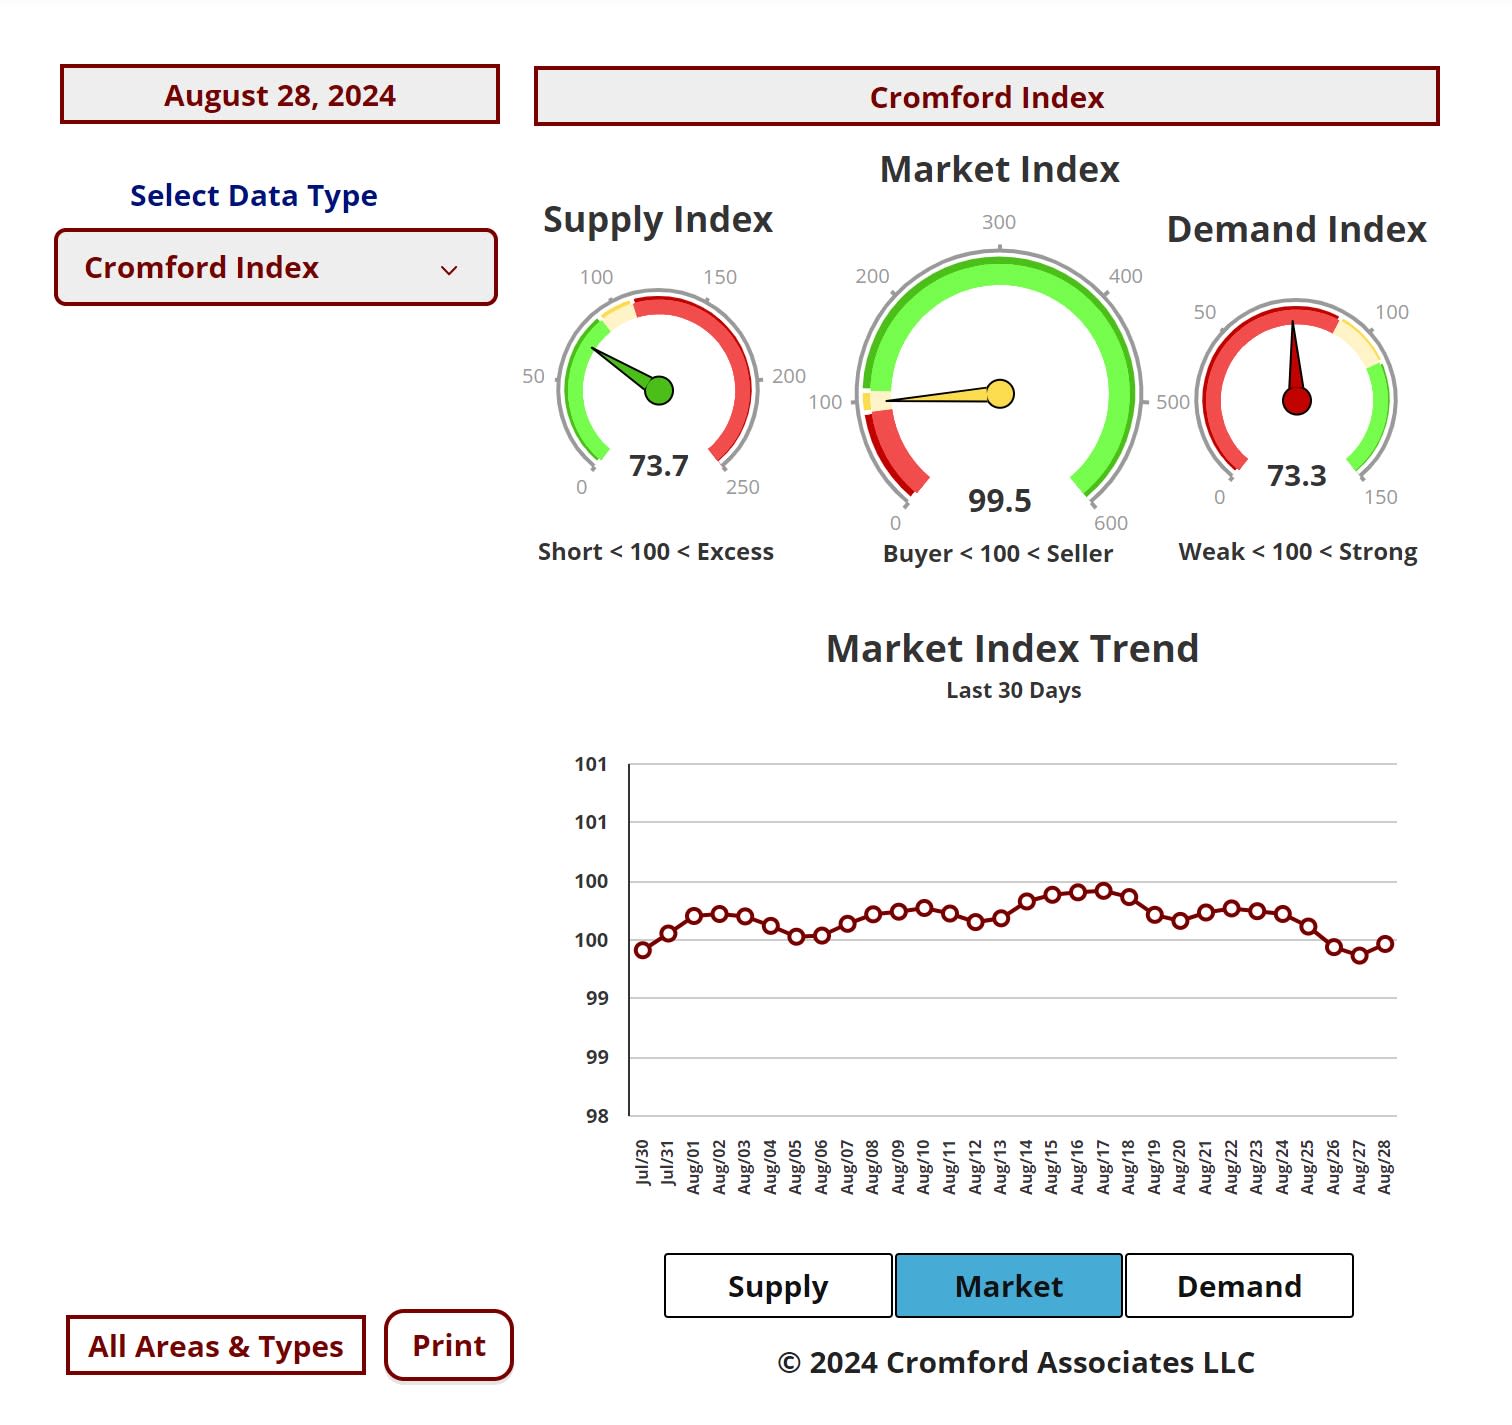
Market Dashboard – Dashboard
recorded by ARMLS are included. Geographically, this includes Maricopa County, a large part of Pinal county and a small
part of Yavapai county. In addition, "out of area" listings recorded on ARMLS are included, although these usually
constitute a very small percentage of total sales and have very little effect on the data.
All dwelling types are included. For-sale-by-owner, auctions and other non-MLS transactions are not included. Land,
commercial units, and multiple dwelling units are also excluded.
Daily Market Snapshot
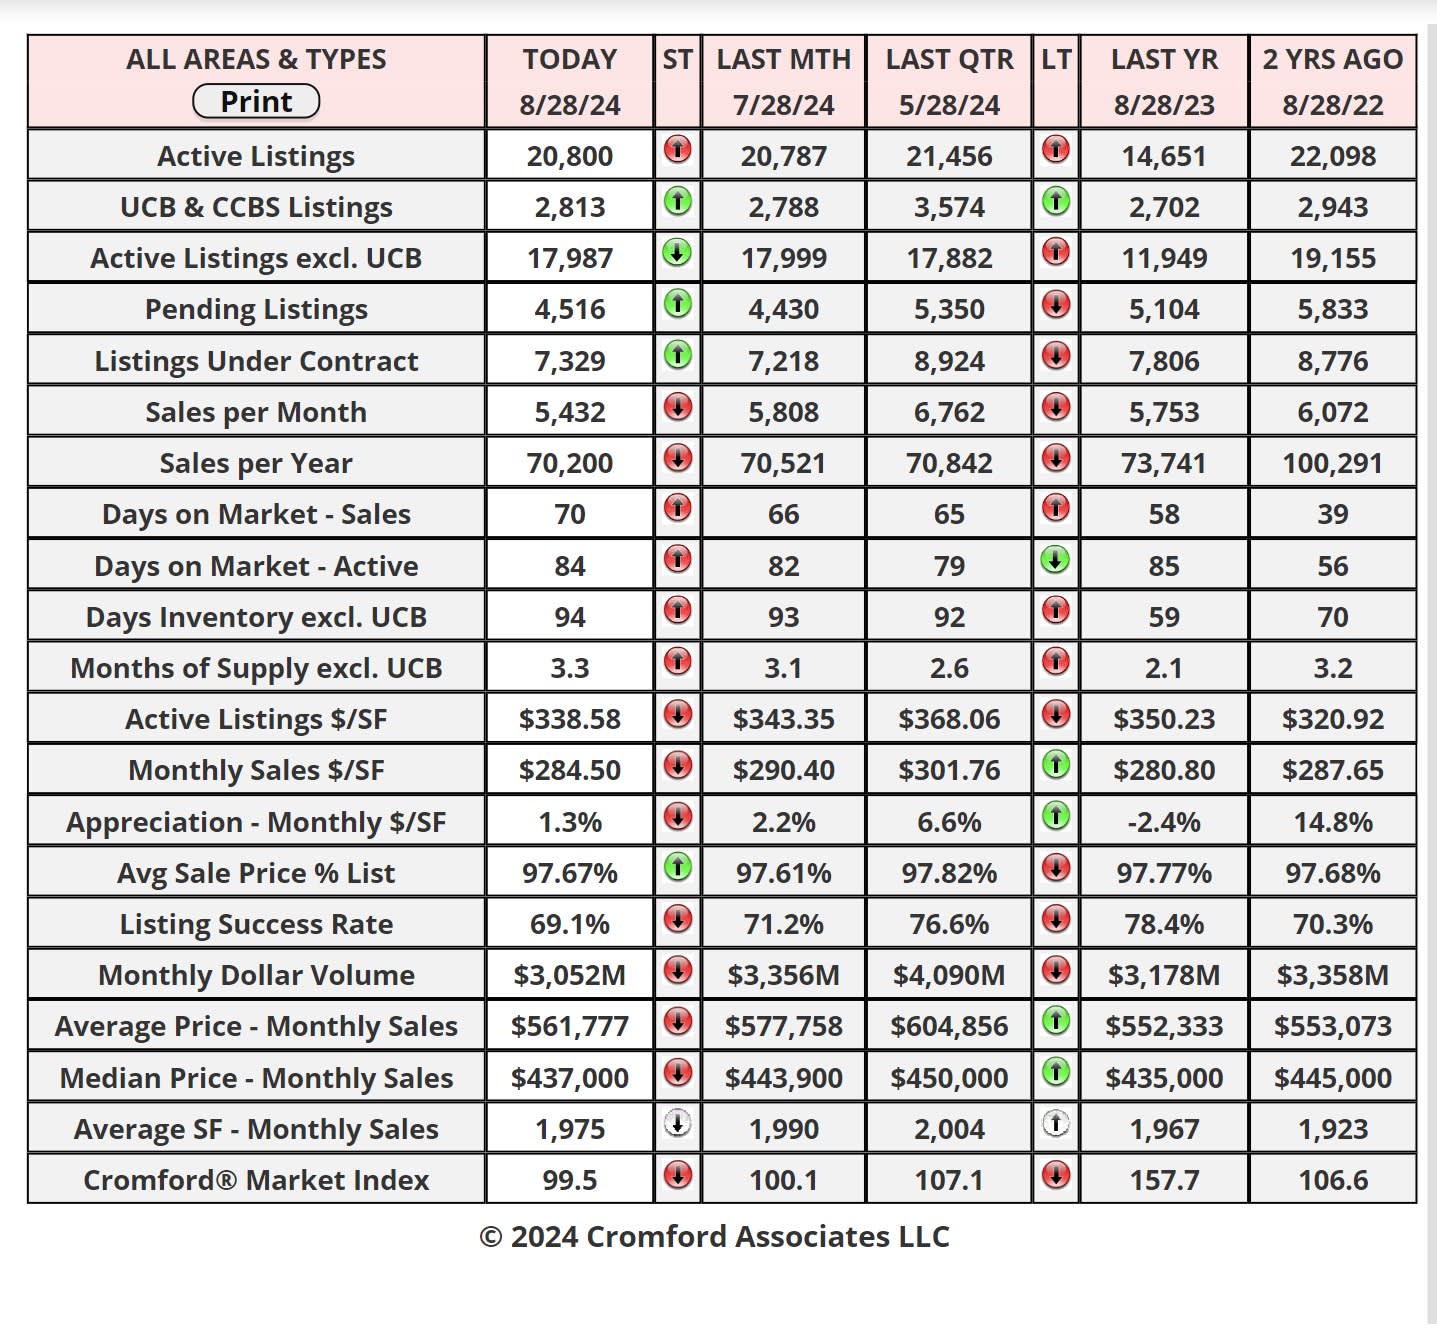
The table below provides a concise statistical summary of today's residential resale market in the Phoenix metropolitan
area. The figures shown are for the entire Arizona Regional area as defined by ARMLS. All residential resale transactions
recorded by ARMLS are included. Geographically, this includes Maricopa county, the majority of Pinal county and a small
part of Yavapai county. In addition, "out of area" listings recorded in ARMLS are included, although these constitute a very
small percentage (typically less than 1%) of total sales and have very little effect on the statistics.
cities.
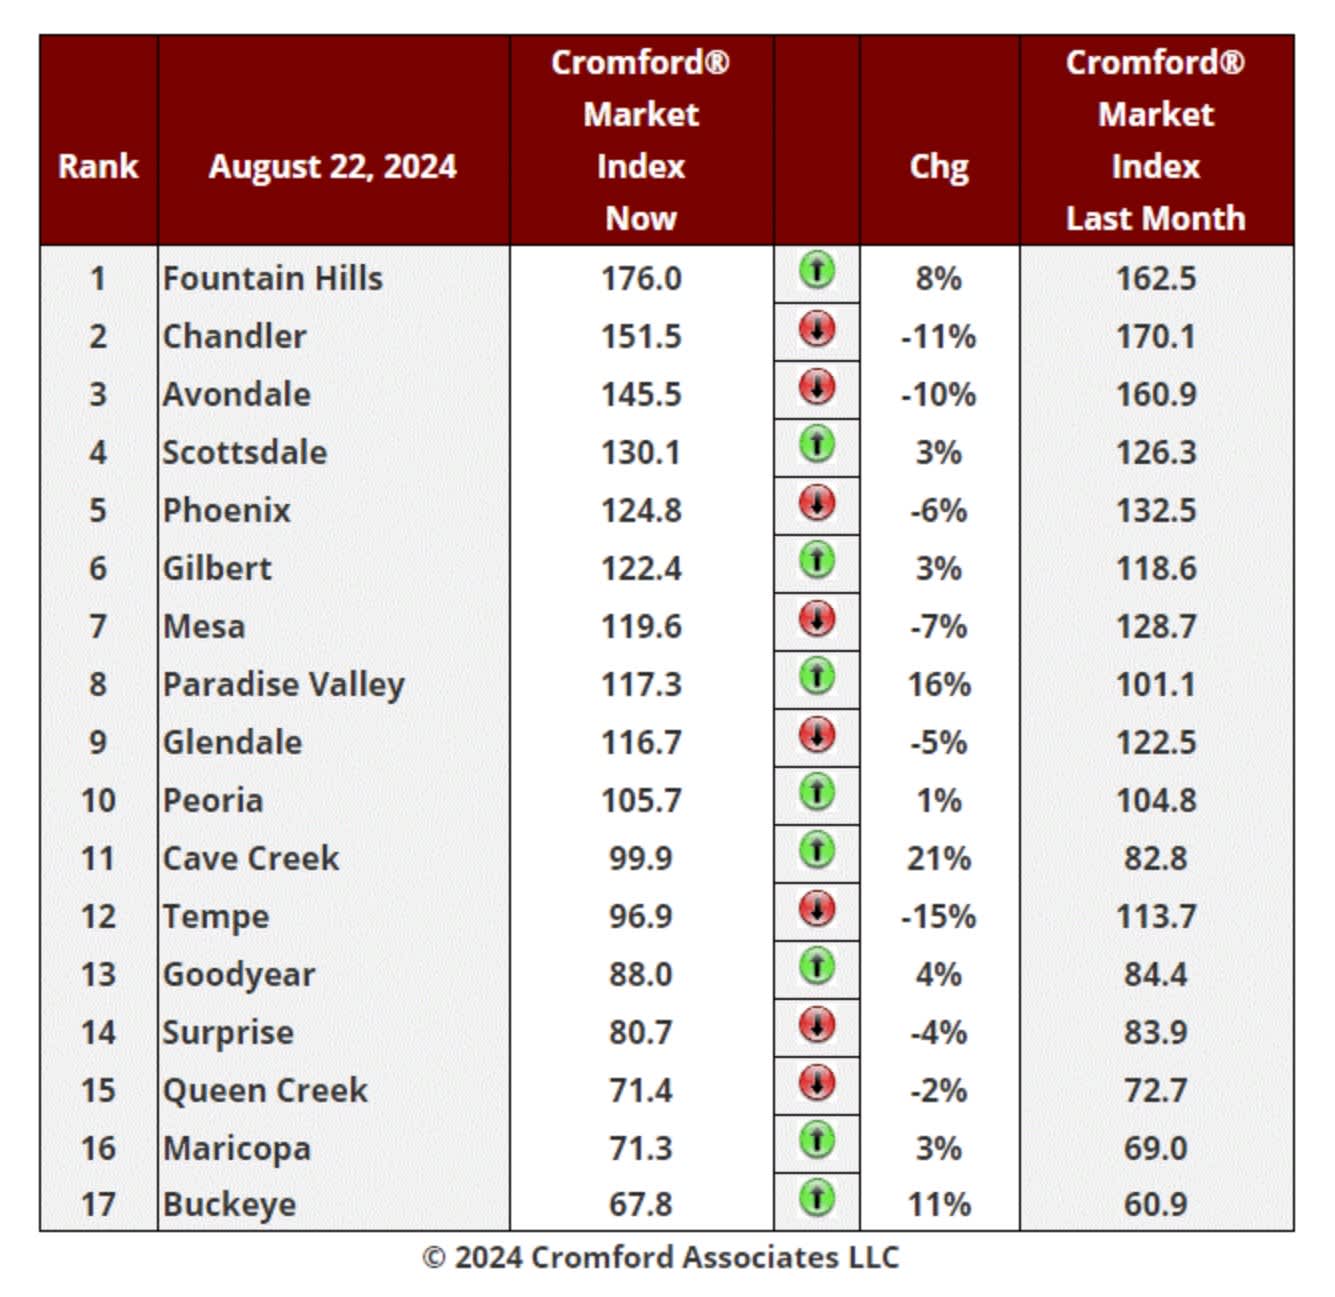
Cromford® Market Index over the past month, up from 8 last week. We have 8 cities showing a decrease. That is
a small majority going up and this is the first time we have seen this situation since May 9.
The change is still painfully slow, but it is real. The trend has reversed but is yet to gather any significant momentum.
The average change in CMI over the past month is +0.7%, our first positive change since May 23. Last week we
saw -0.1%.
The market is starting to improve for sellers overall and I hope buyers took good advantage of their opportunity to
negotiate harder over the last 3 months.
Cave Creek, Paradise Valley, Buckeye and Fountain Hills show the largest percentage gains. In addition,
Scottsdale, Gilbert, Maricopa, Goodyear and Peoria are all up over the last month. The largest declines are still
concentrated in the Southeast Valley (Tempe, Chandler and Mesa), but Avondale has weakened substantially as
well.
9 out of 17 cities remain seller's markets over 110. We have 3 cities that are balanced, while the remaining 5 are
buyer's markets. 3 cities still remain over 140 while 3 remain under 75.
Latest S&P / Case-Shiller Home Price Index
Aug 27 - The latest S&P / Case-Shiller® Home Price Index® numbers were published this Tuesday.
The new report covers home sales during the period April to June 2024. This means the typical home sale closed
in mid-May, more than 3 months ago. Please remember that Case-Shiller data is fairly old, even on the day it is
released.
All 20 cities show rising prices for last month.
Comparing with the previous month's series we see the following changes:
1. Detroit +1.13%
2. Chicago +0.95%
3. Las Vegas +0.84%
4. Cleveland +0.76%
5. Atlanta +0.72%
6. Boston +0.68%
7. Miami +0.66%
8. San Diego +0.65%
9. Minneapolis +0.63%
10. Los Angeles +0.61%
11. Seattle +0.59%
12. Washington +0.58%
13. New York +0.56%
14. Charlotte +0.48%
15. Phoenix +0.42%
16. Dallas +0.39%
17. Denver +0.25%
18. Tampa +0.21%
19. Portland +0.13%
20. San Francisco +0.07%
Phoenix has risen from 19th to 15th place over the last month. The national average was +0.47% so Phoenix prices
rose slightly less than the national average.
The North, Las Vegas and Atlanta remain strongest.
Comparing year over year, we see the following changes:
1. New York +9.0%
2. San Diego +8.7%
3. Las Vegas +8.5%
4. Los Angeles +8.2%
5. Chicago +7.0%
6. Detroit +7.0%
7. Miami +6.9%
8. Cleveland +6.7%
9. Seattle 6.7%
10. Boston +6.6%
11. Charlotte +6.4%
12. Washington +6.0%
13. Atlanta +5.1%
14. San Francisco +4.3%
15. Phoenix +3.7%
16. Tampa +3.1%
17. Dallas +2.3%
18. Minneapolis +2.0%
19. Denver +1.9%
20. Portland +0.8%
Phoenix dropped one place to 15th and is still stuck in the bottom half on a year over year basis. All 20 of the cities
are again showing positive price movement from one year ago with Denver and Portland once again at the bottom.
Las Vegas is looking strong on both tables.
The national average is +5.4% year over year. Phoenix is below that percentage, and in a similar situation to the
last four months.
Single Family Permits Commentary
Aug 25 - 2024 has seen a rebound in the number of single-family building permits issued in Maricopa and Pinal
counties.
So far (until the end of July) we have counted 18,498 single-family units which is up more than 40% from the same
period last year. However, it is not quite up to the booming levels of 2021 and 2022 when we counted 21,796 and
19,748 respectively. The re-sale market has been much weaker than the new home market and year-to-date closing
volumes are down from 2023 - 45,937 as of the end of June 2024, which is down 4% from the same period last
year. We do not often see the new home and re-sale markets so disconnected from each other.
Homebuilders are clearly optimistic about the market, especially given the Federal Reserve positioning on reduced
interest rates. Many of the publicly traded developers saw their stock prices hit all-time highs over the last week.
Permits are up 39% in Maricopa County and up 43% in Pinal County. They are also up almost 38% for Arizona's13 other counties.
The year-to-date permit counts by location are as follows:
1. Unincorporated Pinal County 2,849
2. Phoenix 2,331
3. Surprise 2,039
4. Buckeye 1,484
5. Unincorporated Maricopa County 1,205
© 2023 Cromford Associates LLC - Walt Danley Local Luxury | Christie’s International Real Estate
6. Queen Creek 1,112
7. Peoria 1,098
8. Goodyear 1,092
9. Maricopa 883
10. Casa Grande 722
This list is very different from the re-sale market. Note that Mesa, Glendale, Scottsdale, Gilbert and Chandler
didn't make the top 10.
The failure of San Tan Valley to incorporate means we have an extremely large number of new homes going into
locations that are not managed by a city or town, but just the county administration. There is now a renewed effort
to incorporate, and a vote is scheduled for later this year to determine if this effort can proceed.
Florence is growing fast and is now receiving more permits than Gilbert and threatening to overtake Scottsdale.