
Market Statistics Report for
December 26, 2023
Market Dashboard
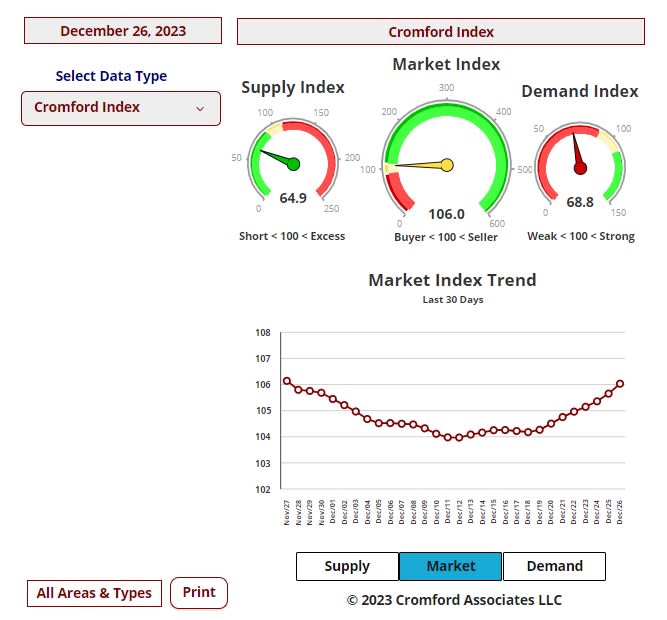
This Dashboard provides a comprehensive summary of the current state of the overall residential resale market.
All the statistics shown are for the entire Arizona Regional area as defined by ARMLS. All residential resale transactions recorded by ARMLS are included. Geographically, this includes Maricopa County, a large part of Pinal County, and a small part of Yavapai County. In addition, "out of area" listings recorded on ARMLS are included, although these usually constitute a very small percentage of total sales and have very little effect on the data.
All dwelling types are included. For-sale-by-owner, auctions, and other non-MLS transactions are not included. Land, commercial units, and multiple dwelling units are also excluded.
All the statistics shown are for the entire Arizona Regional area as defined by ARMLS. All residential resale transactions recorded by ARMLS are included. Geographically, this includes Maricopa County, a large part of Pinal County, and a small part of Yavapai County. In addition, "out of area" listings recorded on ARMLS are included, although these usually constitute a very small percentage of total sales and have very little effect on the data.
All dwelling types are included. For-sale-by-owner, auctions, and other non-MLS transactions are not included. Land, commercial units, and multiple dwelling units are also excluded.
Daily Market Snapshot – City Ranking
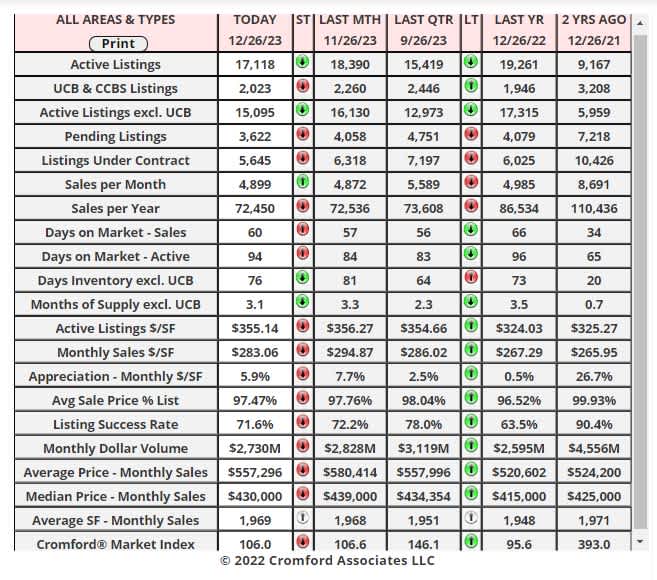
The table below provides a concise statistical summary of today's residential resale market in the Phoenix metropolitan area. The figures shown are for the entire Arizona Regional area as defined by ARMLS. All residential resale transactions recorded by ARMLS are included. Geographically, this includes Maricopa County, the majority of Pinal County, and a small part of Yavapai County. In addition, "out of area" listings recorded in ARMLS are included, although these constitute a very small percentage (typically less than 1%) of total sales and have very little effect on the statistics.
Market Index
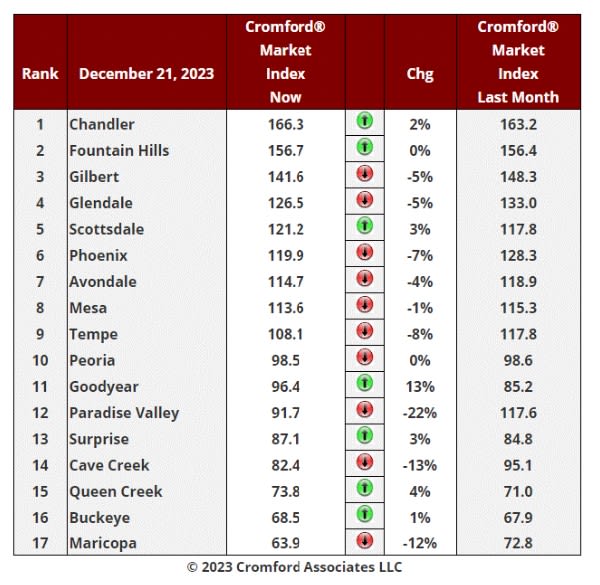
Dec 21 - Here is our latest table of Cromford® Market Index values for the single-family markets in the 17 largest cities.
Market Index Commentary
There has been an average decline of 3.0% in the Cromford® Market Index for the 17 cities above over the last month. This is a big improvement over the 6.7% decline we saw last week, but the average CMI is still somewhat lower than a month ago. However, the average CMI has not fallen over the past week has risen by 1% and we are now officially in a recovery trend.
Moving up over the past month, Scottsdale, Goodyear and Chandler have been joined by Fountain Hills, Surprise, Queen Creek and Buckeye. Only Paradise Valley, Cave Creek and Maricopa are still showing double-digit percentage declines over the last month.
8 out of 17 cities are still seller's markets. We have 4 cities that are balanced and 5 that are buyer's markets. Maricopa stands out as by far the weakest market of the 17 and it has yet to turn around.
Moving up over the past month, Scottsdale, Goodyear and Chandler have been joined by Fountain Hills, Surprise, Queen Creek and Buckeye. Only Paradise Valley, Cave Creek and Maricopa are still showing double-digit percentage declines over the last month.
8 out of 17 cities are still seller's markets. We have 4 cities that are balanced and 5 that are buyer's markets. Maricopa stands out as by far the weakest market of the 17 and it has yet to turn around.
S&P / Case Shiller Home Price Index
Dec 26 - The latest S&P / Case-Shiller® Home Price Index® numbers were published this Tuesday.
The new report covers home sales during the period August to October 2023. This means the typical home sale closed in mid-September, more than 3 months ago. Please remember that Case-Shiller data is fairly old, even on the day it is released.
We have 11 of the 20 cities showing rising prices for last month, with a higher index for Phoenix for the eighth month in a row. However, 9 cities declined over the last month with Portland the most affected.
Compared with the previous month's series we see the following changes:
1. Miami +0.6%
2. Phoenix +0.6%
3. New York +0.5%
4. Los Angeles +0.4%
5. Boston +0.3%
6. Detroit +0.3%
7. Las Vegas +0.3%
8. Charlotte +0.3%
9. Chicago +0.2%
10. Atlanta +0.2%
11. Cleveland +0.2%
12. Tampa -0.0%
13. San Diego -0.1%
14. Washington -0.3%
15. Dallas -0.3%
16. Minneapolis -0.3%
17. Seattle -0.5%
18. Denver -0.6%
19. San Fransisco -0.6%
20. Portland -0.9%
Phoenix has risen from 5th to 2nd place since last month. The national average increase month to month was +0.17%, so Phoenix remains well ahead of that standard.
Comparing year over year, we see the following changes:
1. Detroit +8.1%
2. San Diego +7.2%
3. New York +7.1%
4. Chicago +6.9%
5. Miami +6.7%
6. Boston +6.6%
7. Cleveland +6.4%
8. Los Angeles +6.1%
9. Charlotte +6.0%
10. Atlanta +5.3% © 2023 Cromford Associates LLC - Walt Danley Local Luxury | Christie’s International Real Estate
11. Washington +4.7%
12. Minneapolis +2.8%
13. Tampa +2.3%
14. San Francisco +1.6%
15. Denver +1.6%
16. Seattle +1.5%
17. Dallas +1.2%
18. Phoenix +0.9%
19. Las Vegas +0.1%
20. Portland -0.6%
Phoenix has crept up from 19th to 18th place, but still among the weakest cities on a year over year basis. 19 of the 20 cities are now showing positive price movement from one year ago and once again most of the northern cities are looking good on the year over year measure, along with Southern California.
The national average is +4.8% year over year.
Once again there is no evidence of either a local or national housing price crash over the last 12 months. Only Portland is showing a small decline from 12 months ago.
Dec 23 - The monthly average price per sq. ft. across all areas & types in the ARMLS database is up 6.4% from 12 months ago. $266.78 has moved to $283.87.
Many of the so-called real estate pundits on YouTube and elsewhere were predicting a massive crash of up to 70% (yes, seriously) for Phoenix housing. They did not do this because they have a deep understanding of how the housing market works (obviously). They did it because predictions of disaster catch people's attention, generate views and therefore advertising revenue for Google and the video publisher. There is no shame involved.
You may be wondering what these pundits do when their older videos are proven to be so massively wrong by the real world. They just delete their older videos and publish the same predictions for the next year. Repeat again and again.
Some have been doing this for many years and there always seem to be enough new viewers gullible enough to keep watching their crazy predictions. Being consistently wrong for several years does not seem to dampen their enthusiasm for making videos. They must like the income I suppose. By deleting all their videos more than 3 months old, they hide how appalling their forecasting ability has been shown to be. In the wider economic world, there are many book authors in the same mold who sell lots of books but get their predictions wrong year after year. Harry Dent springs immediately to mind, but there are lots more.
The Cromford® Report market commentary is based on actual data, careful statistical mathematical calculation and over 20 years of experience measuring the Phoenix market. We never delete any of our materials. You can check what we said for what actually happened.
During the first quarter, several subscribers wrote to us and said we might be too optimistic, but the numbers never lie to us. The housing market has survived intact and is now in better health pricewise than it was this time last year, though admittedly we could all do with a lot more transaction volume. These emails were valuable to me because I took them as a signal that public perception was much worse than reality, even for experienced and highly competent professionals.
The last 200 years have shown us that for home prices to go significantly down, we must have an excess of homes for sale chasing too few buyers. Right now, buyers are indeed thin on the ground, but we still have overall supply well below normal and heading lower. For a housing crash we would need a flood of new homes for sale. The reason it might occur is not important, but without this flood, prices will remain stable at worst.
The new report covers home sales during the period August to October 2023. This means the typical home sale closed in mid-September, more than 3 months ago. Please remember that Case-Shiller data is fairly old, even on the day it is released.
We have 11 of the 20 cities showing rising prices for last month, with a higher index for Phoenix for the eighth month in a row. However, 9 cities declined over the last month with Portland the most affected.
Compared with the previous month's series we see the following changes:
1. Miami +0.6%
2. Phoenix +0.6%
3. New York +0.5%
4. Los Angeles +0.4%
5. Boston +0.3%
6. Detroit +0.3%
7. Las Vegas +0.3%
8. Charlotte +0.3%
9. Chicago +0.2%
10. Atlanta +0.2%
11. Cleveland +0.2%
12. Tampa -0.0%
13. San Diego -0.1%
14. Washington -0.3%
15. Dallas -0.3%
16. Minneapolis -0.3%
17. Seattle -0.5%
18. Denver -0.6%
19. San Fransisco -0.6%
20. Portland -0.9%
Phoenix has risen from 5th to 2nd place since last month. The national average increase month to month was +0.17%, so Phoenix remains well ahead of that standard.
Comparing year over year, we see the following changes:
1. Detroit +8.1%
2. San Diego +7.2%
3. New York +7.1%
4. Chicago +6.9%
5. Miami +6.7%
6. Boston +6.6%
7. Cleveland +6.4%
8. Los Angeles +6.1%
9. Charlotte +6.0%
10. Atlanta +5.3% © 2023 Cromford Associates LLC - Walt Danley Local Luxury | Christie’s International Real Estate
11. Washington +4.7%
12. Minneapolis +2.8%
13. Tampa +2.3%
14. San Francisco +1.6%
15. Denver +1.6%
16. Seattle +1.5%
17. Dallas +1.2%
18. Phoenix +0.9%
19. Las Vegas +0.1%
20. Portland -0.6%
Phoenix has crept up from 19th to 18th place, but still among the weakest cities on a year over year basis. 19 of the 20 cities are now showing positive price movement from one year ago and once again most of the northern cities are looking good on the year over year measure, along with Southern California.
The national average is +4.8% year over year.
Once again there is no evidence of either a local or national housing price crash over the last 12 months. Only Portland is showing a small decline from 12 months ago.
Dec 23 - The monthly average price per sq. ft. across all areas & types in the ARMLS database is up 6.4% from 12 months ago. $266.78 has moved to $283.87.
Many of the so-called real estate pundits on YouTube and elsewhere were predicting a massive crash of up to 70% (yes, seriously) for Phoenix housing. They did not do this because they have a deep understanding of how the housing market works (obviously). They did it because predictions of disaster catch people's attention, generate views and therefore advertising revenue for Google and the video publisher. There is no shame involved.
You may be wondering what these pundits do when their older videos are proven to be so massively wrong by the real world. They just delete their older videos and publish the same predictions for the next year. Repeat again and again.
Some have been doing this for many years and there always seem to be enough new viewers gullible enough to keep watching their crazy predictions. Being consistently wrong for several years does not seem to dampen their enthusiasm for making videos. They must like the income I suppose. By deleting all their videos more than 3 months old, they hide how appalling their forecasting ability has been shown to be. In the wider economic world, there are many book authors in the same mold who sell lots of books but get their predictions wrong year after year. Harry Dent springs immediately to mind, but there are lots more.
The Cromford® Report market commentary is based on actual data, careful statistical mathematical calculation and over 20 years of experience measuring the Phoenix market. We never delete any of our materials. You can check what we said for what actually happened.
During the first quarter, several subscribers wrote to us and said we might be too optimistic, but the numbers never lie to us. The housing market has survived intact and is now in better health pricewise than it was this time last year, though admittedly we could all do with a lot more transaction volume. These emails were valuable to me because I took them as a signal that public perception was much worse than reality, even for experienced and highly competent professionals.
The last 200 years have shown us that for home prices to go significantly down, we must have an excess of homes for sale chasing too few buyers. Right now, buyers are indeed thin on the ground, but we still have overall supply well below normal and heading lower. For a housing crash we would need a flood of new homes for sale. The reason it might occur is not important, but without this flood, prices will remain stable at worst.
Supply is going down, but this is normal for December every year. The important stuff will happen in January. Will more than the usual number of buyers emerge due to falling mortgage rates, or will we see a surge in new listings. The balance between these two measures will determine the direction of prices in the first quarter of 2024 and anyone who tells you they already know what will happen is selling you a lie.
The future is largely unknown, but at least we can understand the present properly. The Cromford® Market Index is in the balanced zone around 105 and increasing slightly. To conclude, we have any credible evidence of an imminent crash would be simply illogical.