
Market Statistics Report for
December 5, 2023
Market Dashboard
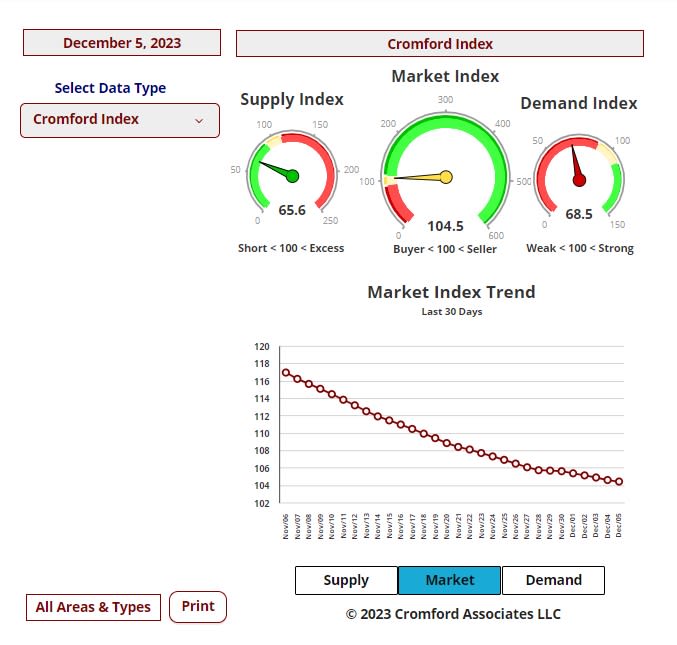
This Dashboard provides a comprehensive summary of the current state of the overall residential resale market.
All the statistics shown are for the entire Arizona Regional area as defined by ARMLS. All residential resale transactions recorded by ARMLS are included. Geographically, this includes Maricopa County, a large part of Pinal County, and a small part of Yavapai County. In addition, "out of area" listings recorded on ARMLS are included, although these usually constitute a very small percentage of total sales and have very little effect on the data.
All the statistics shown are for the entire Arizona Regional area as defined by ARMLS. All residential resale transactions recorded by ARMLS are included. Geographically, this includes Maricopa County, a large part of Pinal County, and a small part of Yavapai County. In addition, "out of area" listings recorded on ARMLS are included, although these usually constitute a very small percentage of total sales and have very little effect on the data.
All dwelling types are included. For-sale-by-owner, auctions, and other non-MLS transactions are not included. Land, commercial units, and multiple dwelling units are also excluded.
Daily Market Snapshot – City Ranking
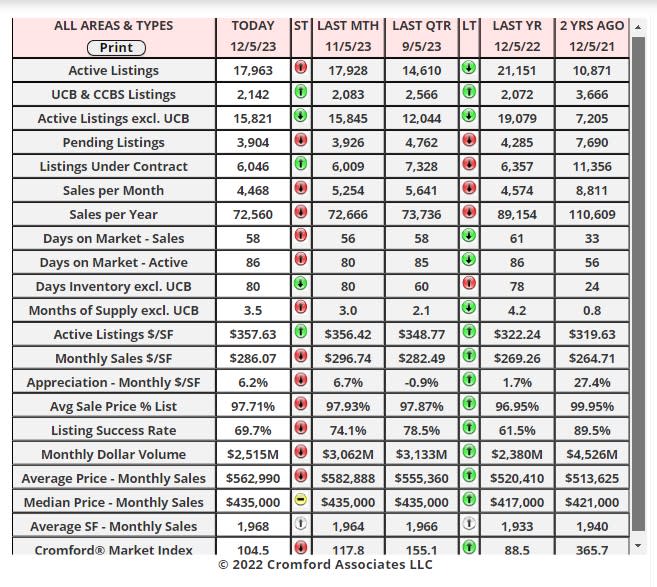
The table below provides a concise statistical summary of today's residential resale market in the Phoenix metropolitan area. The figures shown are for the entire Arizona Regional area as defined by ARMLS. All residential resale transactions recorded by ARMLS are included. Geographically, this includes Maricopa County, the majority of Pinal County, and a small part of Yavapai County. In addition, "out of area" listings recorded in ARMLS are included, although these constitute a very small percentage (typically less than 1%) of total sales and have very little effect on the statistics.
Market Index
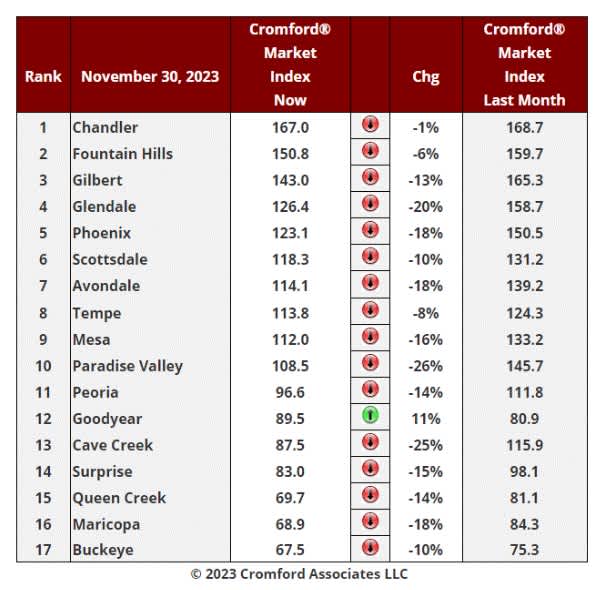
Nov 30 - Here is our latest table of Cromford® Market Index values for the single-family markets in the 17 largest cities.
Market Index Commentary
There was an average decline of 13.1% in the Cromford® Market Index for the 17 cities above. This is an improvement over the 15.2% decline we saw last week and a more substantial improvement than last week.
The majority of cities were worse than average, including Paradise Valley, Cave Creek, Glendale, Phoenix, Surprise, Mesa, Peoria, Maricopa, Queen Creek, and Avondale.
Once again, Goodyear stands out as the only major city that saw its CMI improve over the last month. and it has almost escaped its buyer's market and resumed a balanced status. Also doing relatively well are Chandler, Fountain Hills and Tempe. Scottsdale and Buckeye have improved over the last week.
9 out of 17 cities are still sellers' markets with Paradise Valley and Peoria in the balanced zone while Cave Creek, Surprise, Buckeye, Goodyear, Queen Creek, and Maricopa are all buyers' markets. Maricopa, Queen Creek, and Buckeye have dropped below 70, so buyers have a strong advantage in these locations. The situation for sellers is worse because there is so much competition from new home builders in these areas.
We are seeing gradual improvement in the demand trend, and supply has finally stopped increasing in most areas, which is what we expect to see once Thanksgiving is over.
The majority of cities were worse than average, including Paradise Valley, Cave Creek, Glendale, Phoenix, Surprise, Mesa, Peoria, Maricopa, Queen Creek, and Avondale.
Once again, Goodyear stands out as the only major city that saw its CMI improve over the last month. and it has almost escaped its buyer's market and resumed a balanced status. Also doing relatively well are Chandler, Fountain Hills and Tempe. Scottsdale and Buckeye have improved over the last week.
9 out of 17 cities are still sellers' markets with Paradise Valley and Peoria in the balanced zone while Cave Creek, Surprise, Buckeye, Goodyear, Queen Creek, and Maricopa are all buyers' markets. Maricopa, Queen Creek, and Buckeye have dropped below 70, so buyers have a strong advantage in these locations. The situation for sellers is worse because there is so much competition from new home builders in these areas.
We are seeing gradual improvement in the demand trend, and supply has finally stopped increasing in most areas, which is what we expect to see once Thanksgiving is over.
Listings Under Contract
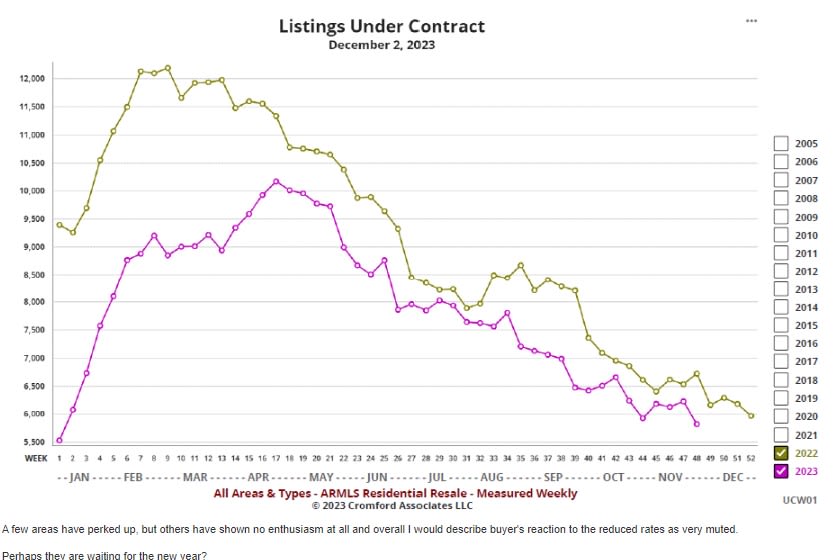
Dec 2 - The typical 30-year fixed mortgage rate has dropped significantly since October, falling from 7.92% on October 30 down to 7.09% as of December 1.
You might have expected this significant drop in the cost of buying a home to result in a jump in the number of people contracting to do so. There have been some reports of a jump in mortgage applications, but as far as the ARMLS database is concerned, the number of listings under contract is distinctly underwhelming - 5,817 as of December 2 and still well below the 2022 number. A few areas have perked up, but others have shown no enthusiasm at all and overall I would describe buyer's reaction to the reduced rates as very muted. Perhaps they are waiting for the new year?
You might have expected this significant drop in the cost of buying a home to result in a jump in the number of people contracting to do so. There have been some reports of a jump in mortgage applications, but as far as the ARMLS database is concerned, the number of listings under contract is distinctly underwhelming - 5,817 as of December 2 and still well below the 2022 number. A few areas have perked up, but others have shown no enthusiasm at all and overall I would describe buyer's reaction to the reduced rates as very muted. Perhaps they are waiting for the new year?
Market Summary for the Beginning of December
Here are the basics - the ARMLS numbers for December 1, 2023, compared with December 1, 2022, for all areas & types:
• Active Listings (excluding UCB & CCBS): 15,981 versus 19,155 last year - down 17% - but up 4.8% from 15,247 last month.
• Active Listings (including UCB & CCBS): 18,050 versus 21,206 last year - down 15% - but up 4.0% compared with 17,364 last month.
• Pending Listings: 3,798 versus 4,301 last year - down 12% - and down 2.9% from 3,911 last month
• Under Contract Listings (including Pending, CCBS & UCB): 5,867 versus 6,352 last year - down 7.6% - and down 2.7% from 6,028 last month.
• Monthly Sales: 4,616 versus 4,928 last year - down 6.3% - and down 11% from 5,210 last month
• Monthly Average Sales Price per Sq. Ft.: $288.97 versus $272.29 last year - up 6.1% - but down 2.1% from $295.13 last month
• Monthly Median Sales Price: $439,000 versus $420,000 last year - up 4.6% - and up 0.9% from $435,000 last month
After rising during October and peaking at an average of just over 8% mid-month, mortgage rates declined thereafter and tumbled throughout November. In theory, this should have injected some life into housing demand, but there is precious little evidence of this in the numbers above. We have fewer homes under contract than last month and far fewer than a year ago when we were all depressed about the low demand. Sales counts are also down from last year and last month reaching the unusually low level of 4,616 in November.
One reason for the severe lack of demand may be that home prices are noticeably higher than a year ago, something few people were predicting 12 months ago. Over the last months, there have been mixed signals. The median sales price grew almost 1% but the average price per square foot dropped by over 2%. This followed a sharp increase the month before. When this happens, it is usually caused by the luxury market. With much lower unit volumes, the luxury market can vary a lot from month to month and the effect on the $/SF can be substantial. The luxury market has a negligible effect on the median sales price. The median sales price tends to be strongly influenced by unit volumes at the low end. Despite the weak demand, supply is still below normal, which is preventing prices from tumbling. Supply has risen for several months but is now stable again as few people list their homes in December and several take their homes off the market for the holiday season. We anticipate more supply appearing in January.
The new home market continues to outperform the resale market. Mortgage rate buy-downs have kept new home demand at a healthy level.
December is not usually a month for us to see a flood of new home buyers, so we anticipate the second half of January will tell us whether buyers see a big difference between mortgage rates around 7% compared with 8%. The last 12 months have been full of surprises, so caution and watching the statistics carefully is still the order of the day.
• Active Listings (excluding UCB & CCBS): 15,981 versus 19,155 last year - down 17% - but up 4.8% from 15,247 last month.
• Active Listings (including UCB & CCBS): 18,050 versus 21,206 last year - down 15% - but up 4.0% compared with 17,364 last month.
• Pending Listings: 3,798 versus 4,301 last year - down 12% - and down 2.9% from 3,911 last month
• Under Contract Listings (including Pending, CCBS & UCB): 5,867 versus 6,352 last year - down 7.6% - and down 2.7% from 6,028 last month.
• Monthly Sales: 4,616 versus 4,928 last year - down 6.3% - and down 11% from 5,210 last month
• Monthly Average Sales Price per Sq. Ft.: $288.97 versus $272.29 last year - up 6.1% - but down 2.1% from $295.13 last month
• Monthly Median Sales Price: $439,000 versus $420,000 last year - up 4.6% - and up 0.9% from $435,000 last month
After rising during October and peaking at an average of just over 8% mid-month, mortgage rates declined thereafter and tumbled throughout November. In theory, this should have injected some life into housing demand, but there is precious little evidence of this in the numbers above. We have fewer homes under contract than last month and far fewer than a year ago when we were all depressed about the low demand. Sales counts are also down from last year and last month reaching the unusually low level of 4,616 in November.
One reason for the severe lack of demand may be that home prices are noticeably higher than a year ago, something few people were predicting 12 months ago. Over the last months, there have been mixed signals. The median sales price grew almost 1% but the average price per square foot dropped by over 2%. This followed a sharp increase the month before. When this happens, it is usually caused by the luxury market. With much lower unit volumes, the luxury market can vary a lot from month to month and the effect on the $/SF can be substantial. The luxury market has a negligible effect on the median sales price. The median sales price tends to be strongly influenced by unit volumes at the low end. Despite the weak demand, supply is still below normal, which is preventing prices from tumbling. Supply has risen for several months but is now stable again as few people list their homes in December and several take their homes off the market for the holiday season. We anticipate more supply appearing in January.
The new home market continues to outperform the resale market. Mortgage rate buy-downs have kept new home demand at a healthy level.
December is not usually a month for us to see a flood of new home buyers, so we anticipate the second half of January will tell us whether buyers see a big difference between mortgage rates around 7% compared with 8%. The last 12 months have been full of surprises, so caution and watching the statistics carefully is still the order of the day.