
Market Statistics Report for February 15, 2024
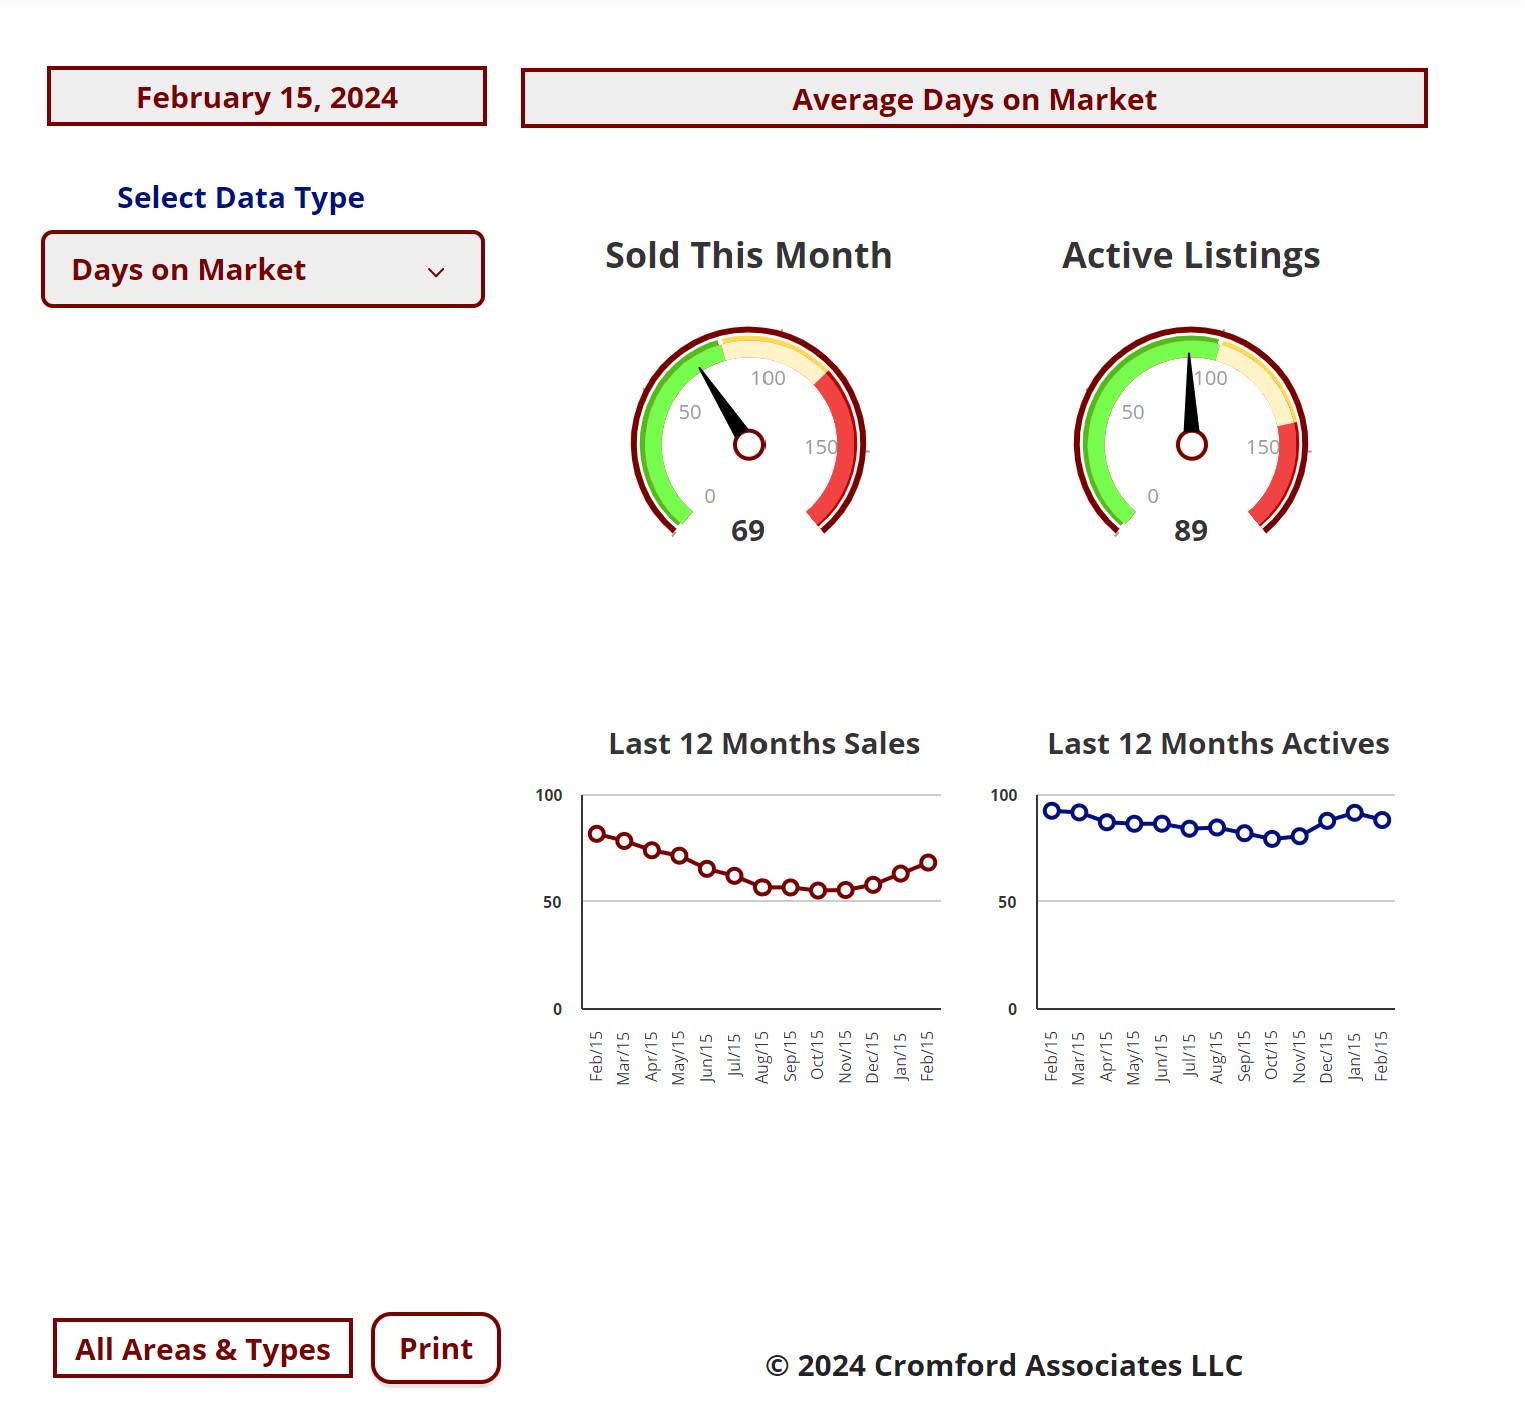
Market Dashboard – Days on Market
This Dashboard provides a comprehensive summary of the current state of the overall residential resale market.
All the statistics shown are for the entire Arizona Regional area as defined by ARMLS. All residential resale transactions
recorded by ARMLS are included. Geographically, this includes Maricopa county, a large part of Pinal county and a small
part of Yavapai county. In addition, "out of area" listings recorded on ARMLS are included, although these usually
constitute a very small percentage of total sales and have very little effect on the data.
All dwelling types are included. For-sale-by-owner, auctions and other non-MLS transactions are not included. Land,
commercial units, and multiple dwelling units are also excluded.
Daily Market Snapshot – City Ranking
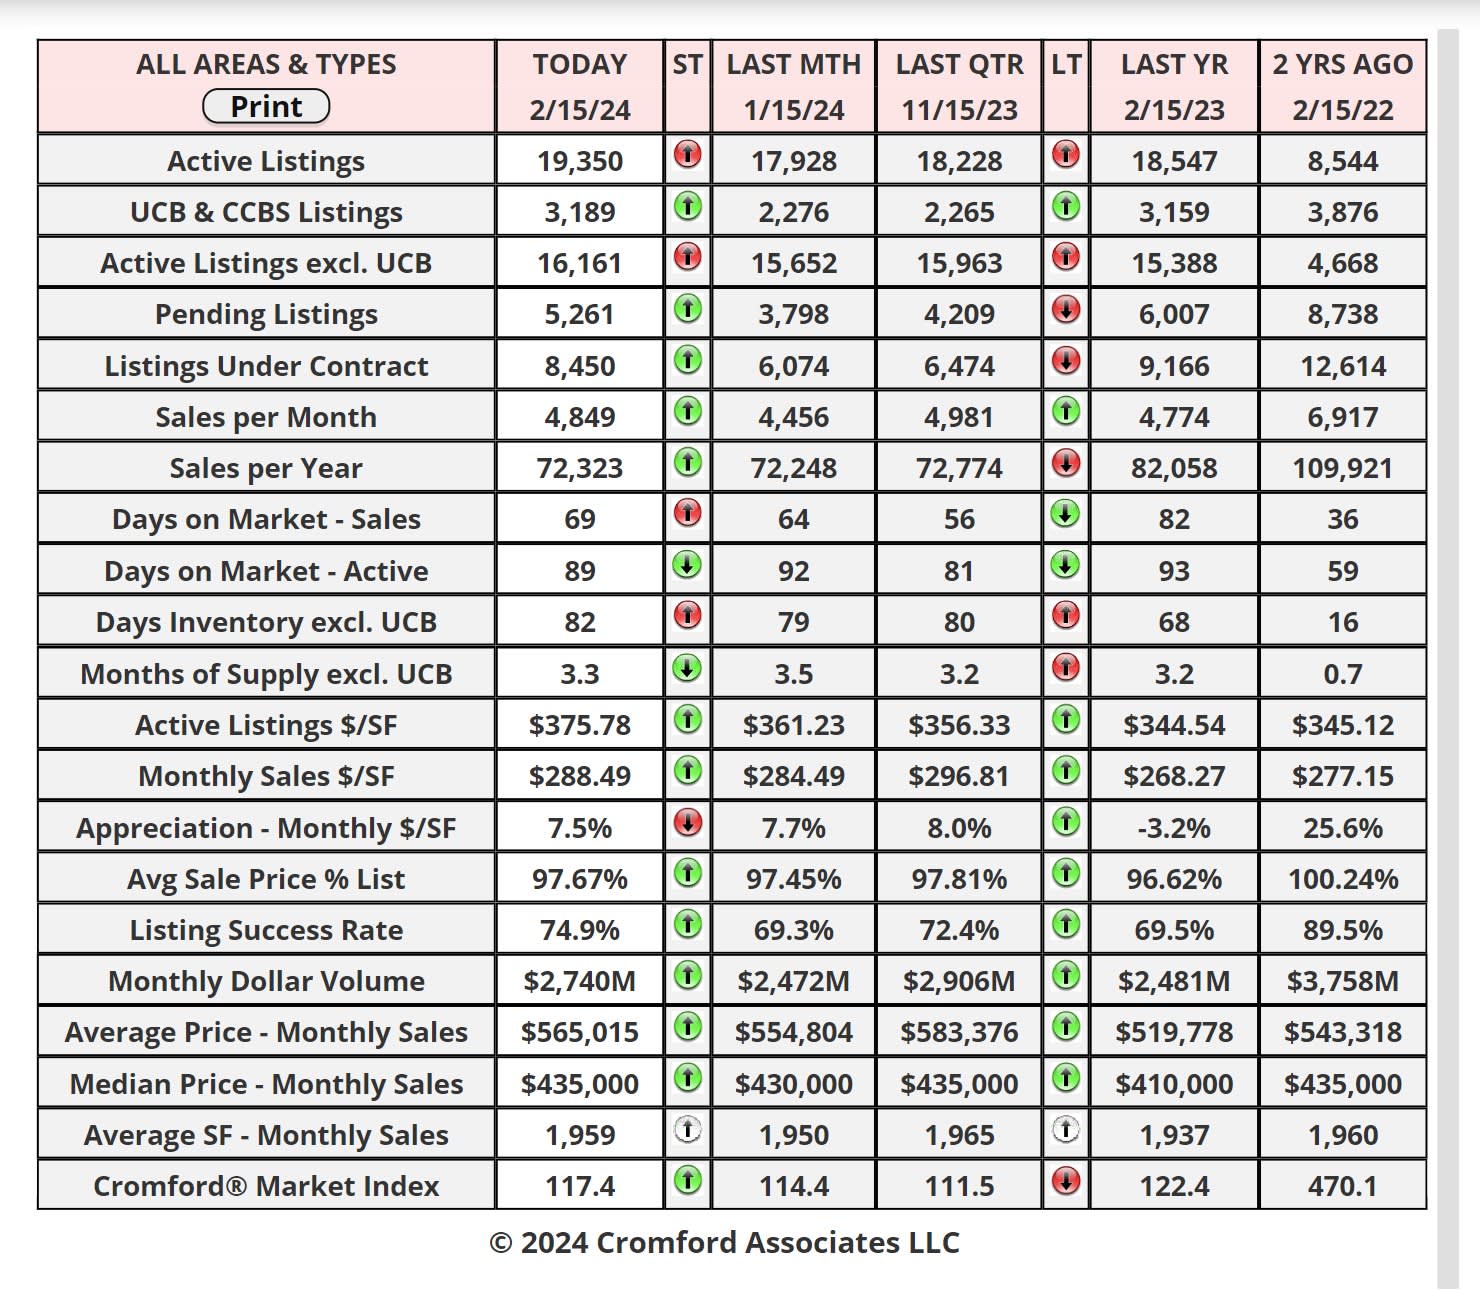
The table below provides a concise statistical summary of today's residential resale market in the Phoenix metropolitan
area. The figures shown are for the entire Arizona Regional area as defined by ARMLS. All residential resale transactions
recorded by ARMLS are included. Geographically, this includes Maricopa county, the majority of Pinal county and a small
part of Yavapai county. In addition, "out of area" listings recorded in ARMLS are included, although these constitute a very
small percentage (typically less than 1%) of total sales and have very little effect on the statistics.
Listings Under Contract – Zip Codes: 85016, 85018, 85253
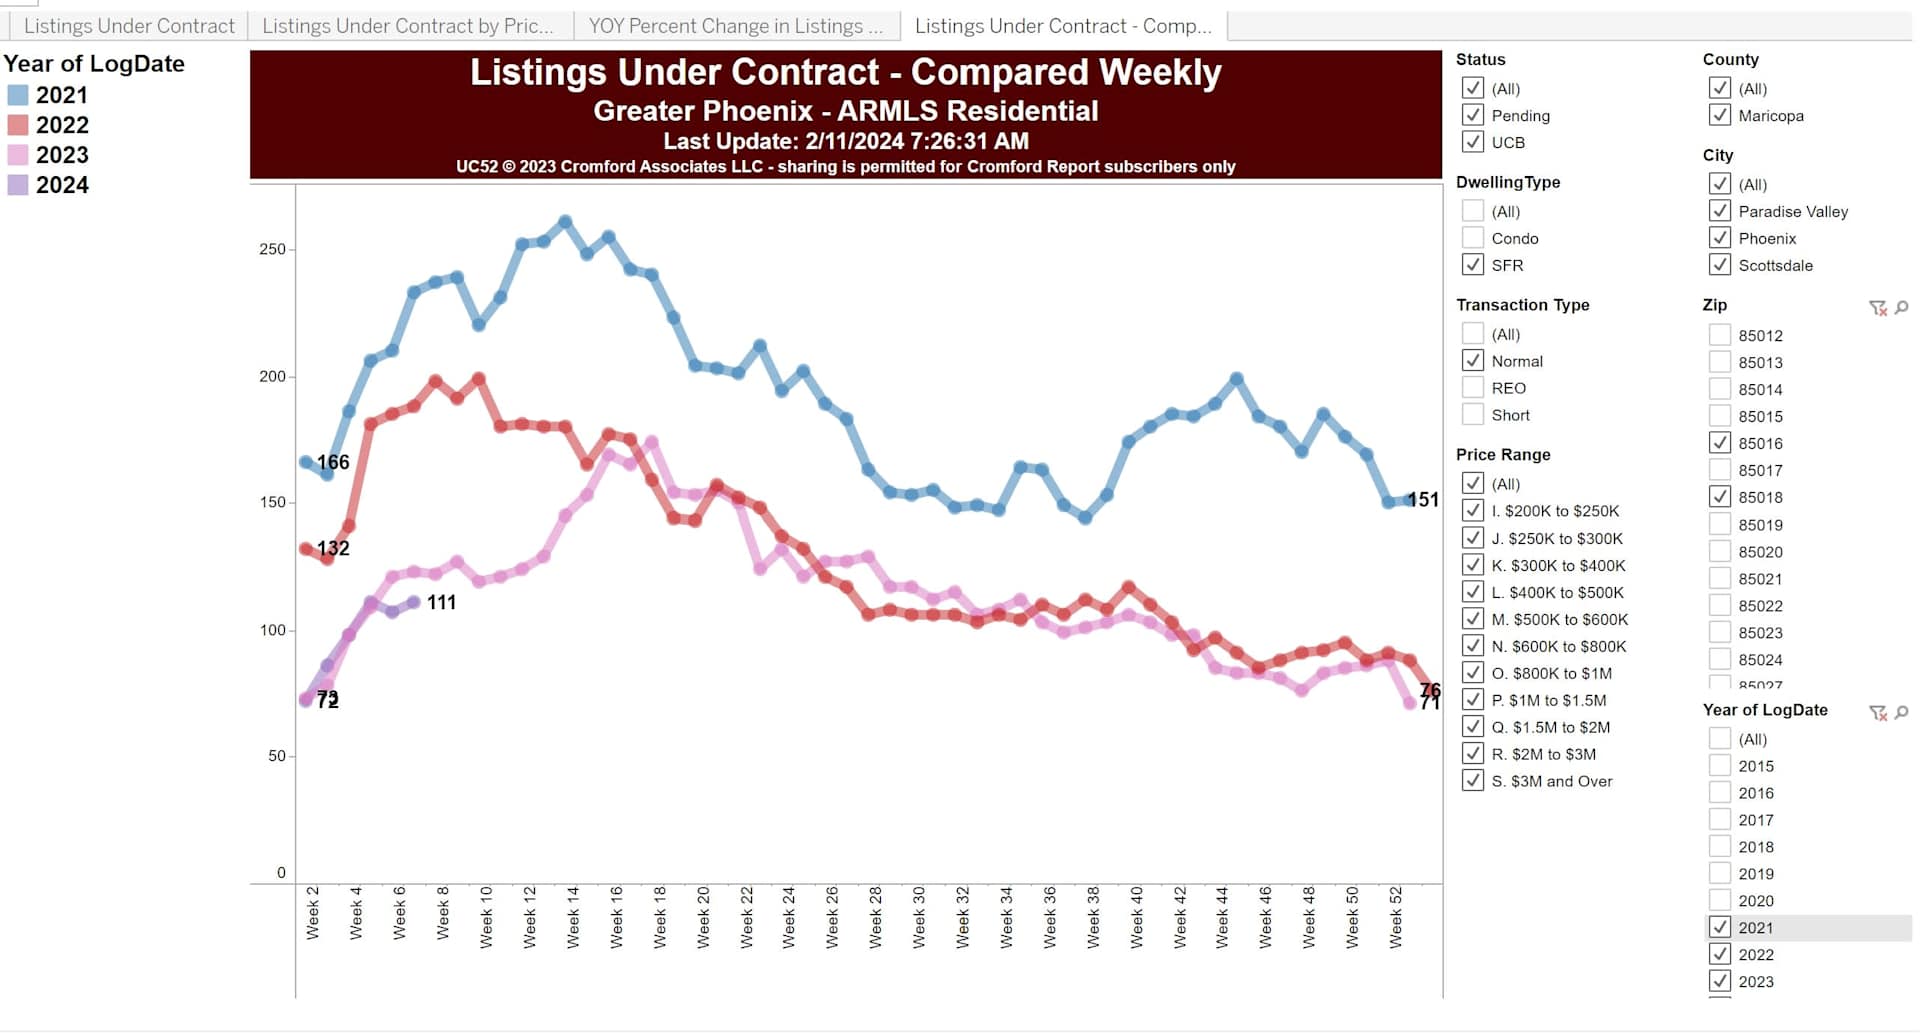
Feb 15 - Here is our latest listings under contract analysis for the zip codes above
How Presidential Elections Affect Housing | Starter Homes Are a Hot Market in Greater Phoenix
With many existing homeowners comfortably staying put these days, more attention is placed on first-time home
buyers, affordability, and supply of homes. The first thing that comes to mind is the choice between renting and
buying. According to RealData the median cost of a 3-bedroom apartment at a 50+ unit complex in Q2 2023 was
$2,100 per month in Maricopa County. The median size is roughly 1,250 square feet. The past 30 days of sales
show the median sale price of a 1,200-1,500 square foot, 3+ bedroom single family starter home to be $370,000
in Greater Phoenix.
Many first-time home buyers put down 3.5% on a FHA loan ($13,000 on $370K), and last month nearly 70% in this
price range had a seller or builder agree to contribute to closing costs with a rate buy-down. That’s a median
contribution of $10,000 from the sellers. On February 1st, the average FHA rate was 6.0% according to Mortgage
News Daily. With a 2/1 buy-down from the seller, the first year estimated payment would be $2,159 per month,
including taxes, insurance, and PMI. A permanent 1% buy-down would equate to $2,375 per month. This puts the
monthly cost to buy a small starter home within a few hundred dollars of the median rental rate.
In Pinal County, the median cost drops to $310,000 and over half of the properties sold in the past 30 days are
newly built within the past 5 years or under contract for 2024. On a 2/1 FHA buy-down, the estimated PITI payment
is $1,825 per month and a permanent 1% buy-down would be $2,006.
Currently there are 366 active single-family listings between 1,200-1,500 square feet, with 3+ bedrooms, under
$370,000 in the Arizona Regional MLS (Pinal County has 53% of them). There are 312 listings under contract and
191 closed in the last 31 days. This is a hot market segment.
2024 is expected to be another year of change for the Greater Phoenix housing industry, but this time the shift is
expected to be towards stability in home appreciation and improved affordability measures as incomes catch up.
After hitting rock bottom for demand in 2023, things are looking up.
For Sellers:
It’s an election year! Every four years there is an expectation that the drama, uncertainty, and manipulation that
comes with presidential campaigns will dramatically affect the housing market, specifically prices or mortgage rates.
Spoiler Alert: It doesn’t. The main influence on the housing market comes from policies, not the elections
themselves. For instance, the stimulus packages and policies that were passed during the 2020 COVID-19 election
year and continued into the next administration were the first stones to cause a ripple effect of fortunate and
unfortunate events in the housing market over the past 4 years.
So what’s to be expected this year? There is one market that can be affected by an election, and that’s the stock
market. After the last 4 elections, the stock market has responded positively afterwards, which affects both luxury
buyers and retirees with a high percentage of cash purchases. If a cash buyer expects their investment portfolio to
be worth more after an election, they may simply put off their home purchase until the Spring. This can cause
contract activity to stagnate for a couple months, but not enough to affect prices, and this mild affect can be offset
by other mitigating factors, like seasonality, that would make the impact unnoticeable.
So far in 2024, listings under contract over $1M are higher than 2022, which is the #1 record year for this price
range. Active listings over $1M are also at record highs, which is offsetting the increased demand and keeping
price appreciation stable. Retirement communities are not experiencing the same however, as this segment is
highly sensitive to inflation. When prices for necessities are high and uncertain, many buyers in this segment will
choose to keep their cash for safekeeping. Perhaps they’ll feel better after the election.