
Market Statistics Report for February 27, 2024
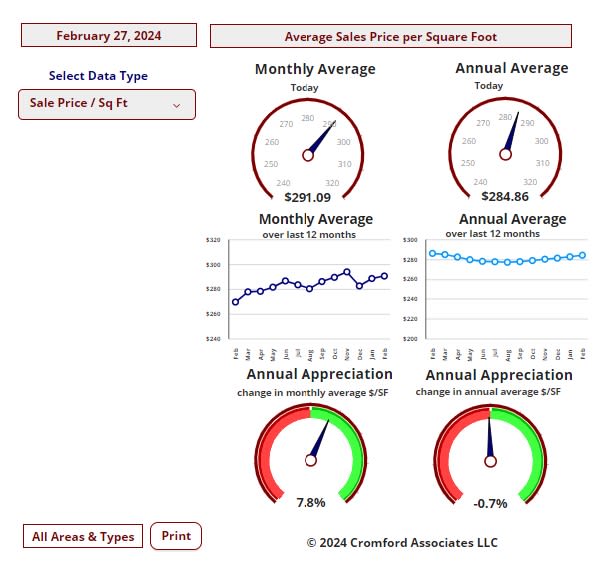
Market Dashboard – Days on Market
This Dashboard provides a comprehensive summary of the current state of the overall residential resale market.
All the statistics shown are for the entire Arizona Regional area as defined by ARMLS. All residential resale transactions
recorded by ARMLS are included. Geographically, this includes Maricopa county, a large part of Pinal county and a small
part of Yavapai county. In addition, "out of area" listings recorded on ARMLS are included, although these usually
constitute a very small percentage of total sales and have very little effect on the data. All dwelling types are included. For-sale-by-owner, auctions and other non-MLS transactions are not included. Land,
commercial units, and multiple dwelling units are also excluded.
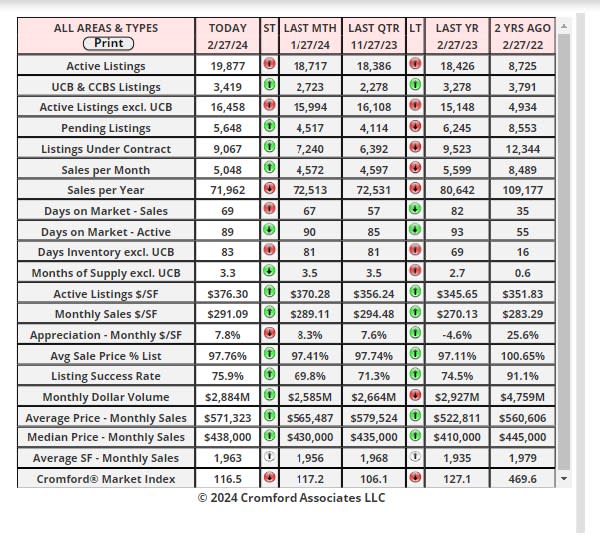
Daily Market Snapshot – City Ranking
area. The figures shown are for the entire Arizona Regional area as defined by ARMLS. All residential resale transactions
recorded by ARMLS are included. Geographically, this includes Maricopa county, the majority of Pinal county and a small
part of Yavapai county. In addition, "out of area" listings recorded in ARMLS are included, although these constitute a very
small percentage (typically less than 1%) of total sales and have very little effect on the statistics.
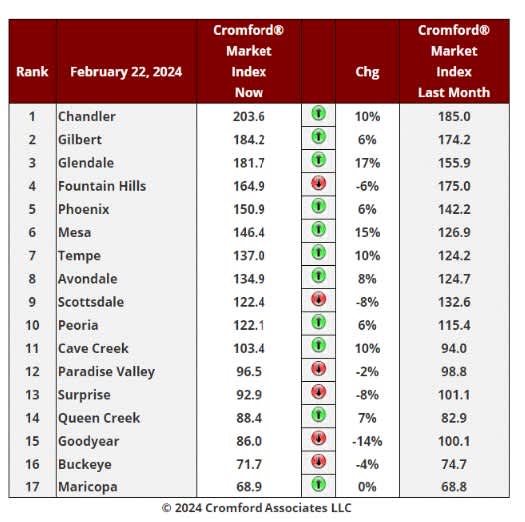
Cromford Market Index
Feb 22 - Here is our latest table of Cromford® Market Index values for the single-family markets in the 17 largest cities.
Cromford Market Index Commentary
deteriorated. Scottsdale, Paradise Valley, Fountain Hills, Surprise, Buckeye, and Goodyear have moved in a
direction that is favorable to buyers. Doing the same over the past week are Cave Creek, Peoria, and Glendale,
while among the secondary cities, Anthem, Apache Junction, Arizona City, Casa Grande, Laveen, Sun City West
and Tolleson all saw their CMI readings fall compared to a week ago.
There has been an average monthly increase of 3.1% in the Cromford® Market Index for the 17 cities, down from
the 5.3% we recorded last week. Thanks to the strong performance of Chandler, Mesa, Gilbert, Tempe and
Phoenix, we are still reporting a positive change over the month, but the trend is definitely weakening and this trend
may not hold for much longer.
10 out of 17 cities are seller's markets. We have 3 cities that are balanced and 4 are buyer's markets.
The overall CMI for the market is stuck near 117 and has fallen slightly over the past 7 days. Demand is still
rising slowly, but so is supply. Both are heading back towards normality, which is a reading of 100. They
have a long way to go, and at 66.6 the Cromford® Supply Index is still below the Cromford Demand® Index
at 78.1, but it is increasing at a slightly faster rate.
Listing Under Contract – Valley Wide
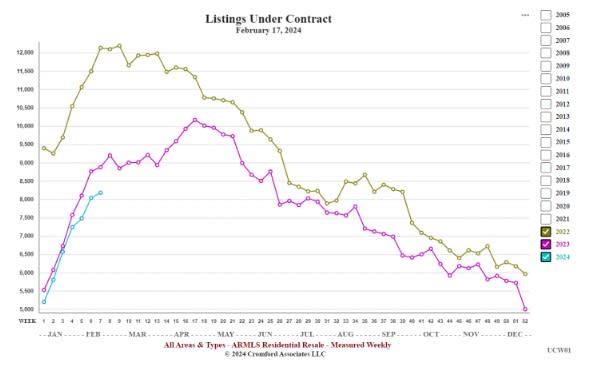
Feb 17 - Listing under contract counts continue to be underwhelming, only reaching 8,182 after 7 weeks of the
year. The same time last year we had 8,877 and 12,131 the year before.
Although demand has improved a little since late 2023, it remains very subdued and is having difficulty catching up
to last year, which was pretty poor in the first place. We are not seeing much enthusiasm among buyers, who were
clearly hoping rates would fall below 6.5% at least.
Last year the market caught a second wind in April but ran out of puff 2 months later. It is by no means clear what
it will do in 2024, but so far it is merely ticking over, providing very little to get excited about.
Latest S&P / Case-Shiller Home Price Index
Feb 27 - The latest S&P / Case-Shiller® Home Price Index® numbers were published this Tuesday.
The new report covers home sales during the period October to December 2023. This means the typical home sale
closed in mid-November, more than 3 months ago. Please remember that Case-Shiller data is older even on the
day it is released.
We have 3 of the 20 cities showing rising prices for last month, with a lower index for Phoenix for the second time
in 10 months. 17 cities declined over the last month with Minneapolis the most affected.
Comparing with the previous month's series we see the following changes:
1. Miami +0.3%
2. Las Vegas +0.2%
3. Los Angeles +0.1%
4. Washington -0.0%
5. New York -0.0%
6. Atlanta -0.1%
7. Charlotte -0.1%
8. Chicago -0.2%
9. Tampa -0.3%
10. Denver -0.5%
11. Seattle -0.5%
12. Phoenix -0.6%
13. Detroit -0.7%
14. Cleveland -0.7%
15. Dallas -0.7%
16. San Diego -0.8%
17. Boston -0.8%
18. San Francisco -0.9%
19. Portland -1.0%
20. Minneapolis -1.0%
Phoenix has dropped from 11th to 12th place since last month. The national average increase month to month was
-0.4%, so Phoenix fell just below that standard.
Comparing year over year, we see the following changes:
1. San Diego +8.8%
2. Los Angeles +8.3%
3. Detroit +8.3%
4. Chicago +8.1%
5. Charlotte +8.0%
6. Miami +7.8%
7. New York +7.6%
8. Cleveland +7.4%
9. Boston +7.2%
10. Atlanta +6.3%
11. Washington +5.1%
12. Las Vegas +4.2%
13. Tampa +4.1%
14. Phoenix +3.8%
15. San Francisco +3.2%
16. Seattle +3.0%
17. Minneapolis +2.9%
18. Denver +2.3%
19. Dallas +2.2%
20. Portland +0.3%
Phoenix remained in14th place and is still in the bottom half on a year over year basis. All 20 of the cities are now
showing positive price movement from one year ago with Portland once again doing relatively poorly. Southern
California is now showing the highest annual appreciation, closely followed by Detroit and Chicago.
The national average is +3.0% year over year. Phoenix is therefore exceeding that percentage, in contrast
to last month.
Feb 26 - Supply is stronger than it was this time last year. It is likely to increase further in 2024 because the number
of single-family building permits issued in January was 2,720 across Maricopa and Pinal counties. This is up a
massive 147% from January 2023 when we counted only 1,102. The home builders appear to be in an ebullient
mood. This is in growing contrast to the re-sale industry which is still struggling with low volumes and weak demand.
The January 2024 count is the highest monthly total since May 2022.