
Market Statistics Report for February 6, 2024
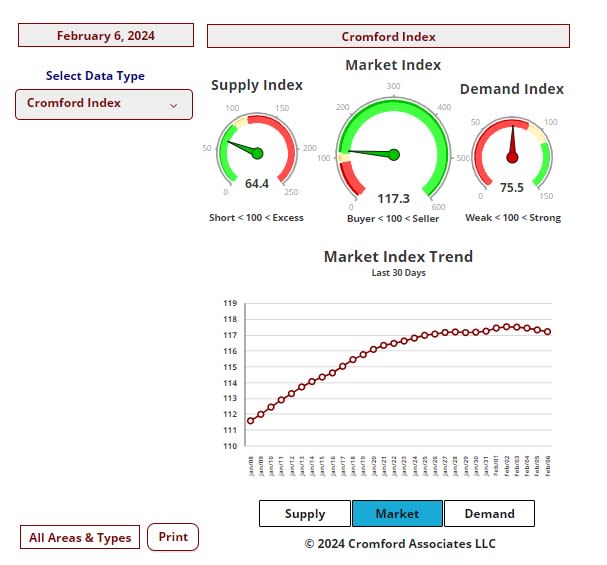
Market Dashboard – Cromford Index
This Dashboard provides a comprehensive summary of the current state of the overall residential resale market.
All the statistics shown are for the entire Arizona Regional area as defined by ARMLS. All residential resale transactions
recorded by ARMLS are included. Geographically, this includes Maricopa county, a large part of Pinal county and a small
part of Yavapai county. In addition, "out of area" listings recorded on ARMLS are included, although these usually
constitute a very small percentage of total sales and have very little effect on the data.
All dwelling types are included. For-sale-by-owner, auctions and other non-MLS transactions are not included. Land,
commercial units, and multiple dwelling units are also excluded.
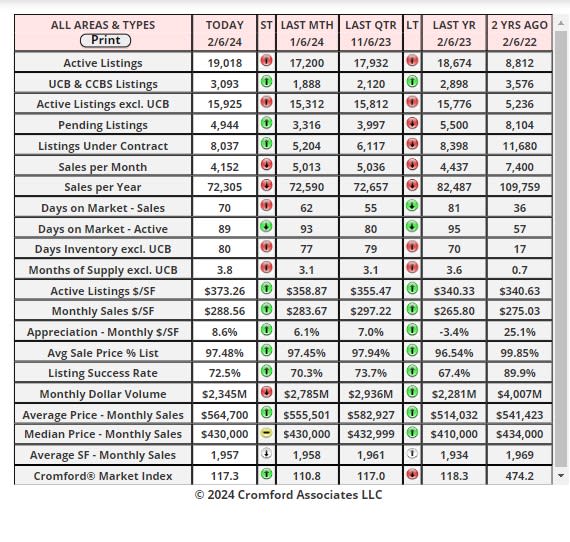
Daily Market Snapshot – City Ranking
area. The figures shown are for the entire Arizona Regional area as defined by ARMLS. All residential resale transactions
recorded by ARMLS are included. Geographically, this includes Maricopa county, the majority of Pinal county and a small
part of Yavapai county. In addition, "out of area" listings recorded in ARMLS are included, although these constitute a very
small percentage (typically less than 1%) of total sales and have very little effect on the statistics.
Market Index
largest cities.

Market Index Commentary
The chart is no longer all-green and the situation is getting interesting. We still have 15 cities showing an increase
in their Cromford® Market Index over the past month, but a few of these have seen a decline in the most recent
week. These include Scottsdale, Surprise and Maricopa.
There has been an average increase of 10.5% in the Cromford® Market Index for the 17 cities, down from the
12.4% we recorded last week. The reason is that supply is mounting rapidly in the more expensive locations and
also in some of the cheapest and most distant areas from Central Phoenix. Faring very well over the last month
are mid-range areas that are not too far from the center of the valley. These include Glendale, Tempe, Chandler,
Gilbert and Peoria, along with Phoenix itself. These markets are looking remarkably strong and price increases are
to be anticipated here.
It is a different story at the top end of the market, which has been flooded with new listings over the past month.
The higher up the price range you go, the more the supply has increased. Paradise Valley has more single-family
homes available now than at any time since November 2020. Carefree has the most homes available since July
2020 while Rio Verde has the most since December 2017. Some sellers in these up-scale areas are facing stiff
competition from other sellers and it would not be surprising if we see significant price cuts among some of these
listings. We have 71 single-family homes priced at $10 million or more. Given that we have never seen more than
29 such listings closed in a single 12-month period, this is a lot of supply. Sellers may need to be either very patient
or flexible.
10 out of 17 cities are seller's markets. We have 4 cities that are balanced and 3 that remain buyer's markets.
Among the secondary cities, Anthem, Apache Junction and Tolleson are out-performing by a long way, but El
Mirage, Litchfield Park, Sun City West, Sun Lakes and Laveen are weakening, and Gold Canyon is already weak
at 80.2.
Casa Grande is very weak indeed and has the lowest CMI at 67.8 and trending lower. Buyers are very much in
control in Casa Grande.
Affidavits of Value – Commentary
Feb 5 - The Affidavits of Value recorded during January by Maricopa County have now been analyzed and show
us the following:
• There were 4,745 closed transactions, up 3.8% from 4,571 in January 2023 but down 5.2% from December.
• There were 1,089 closed new homes, up 10% from 988 in January 2023 but down 21% from December.
• There were 3,656 closed re-sale transactions, up 2% from 3,583 in January 2023 and up 0.9% from December.
• The overall median sales price in January was $455,000, up 3.4% from January 2023 but down 1.1% from
December.
• The re-sale median sales price was $439,000, up 4.5% from January 2023 but down 0.2% from December.
• The new home median sales price was $499,990, down 1.1% from January 2023 and down 1.1% from
December.
Sales counts were weak again in January, though re-sales were slightly higher than December, which is unusual.
Prices were moderately higher than a year ago for re-sales and the market as whole, but the new home median
was lower than last year, mainly because the typical new home is smaller than it was in January 2023.
In summary we have price stability and a low-transaction count, with the new home market taking a higher share
of the market (23%) than normal. Three years ago new homes were less than 15% of the total units sold.
These numbers are for single family and townhouse / condo homes.