
Market Statistics Report for
January 11, 2024
Market Dashboard
This Dashboard provides a comprehensive summary of the current state of the overall residential resale market.
All the statistics shown are for the entire Arizona Regional area as defined by ARMLS. All residential resale transactions
recorded by ARMLS are included. Geographically, this includes Maricopa county, a large part of Pinal county and a small
part of Yavapai county. In addition, "out of area" listings recorded on ARMLS are included, although these usually
constitute a very small percentage of total sales and have very little effect on the data.
All dwelling types are included. For-sale-by-owner, auctions and other non-MLS transactions are not included. Land,
commercial units, and multiple dwelling units are also excluded.
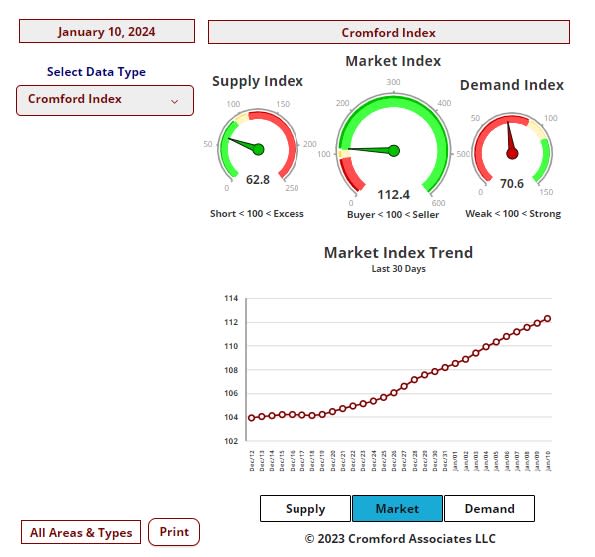
Daily Market Snapshot – City Ranking
The table below provides a concise statistical summary of today's residential resale market in the Phoenix metropolitan
area. The figures shown are for the entire Arizona Regional area as defined by ARMLS. All residential resale transactions
recorded by ARMLS are included. Geographically, this includes Maricopa county, the majority of Pinal county and a small
part of Yavapai county. In addition, "out of area" listings recorded in ARMLS are included, although these constitute a very
small percentage (typically less than 1%) of total sales and have very little effect on the statistics.
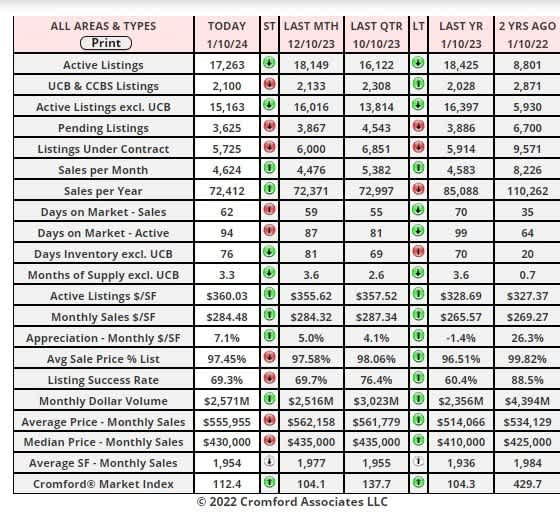
Market Index
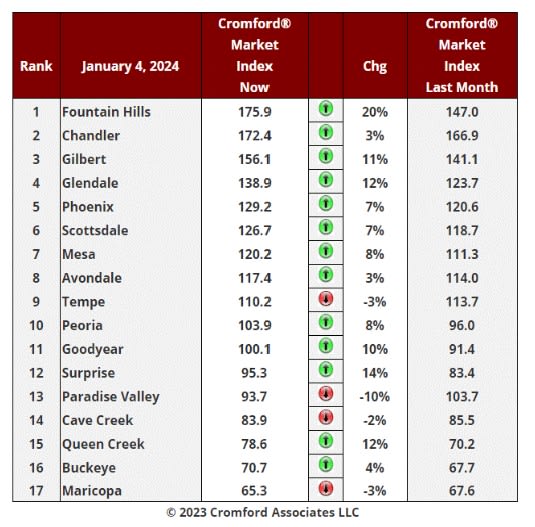
Jan 4 - Here is our latest table of Cromford® Market Index values for the single-family markets in the 17
largest cities.
Market Index Commentary
The same 4 cities as last week are showing red, and the same 13 cities are seeing their Cromford Market Index
increase since December 4. However, there has been an average increase of 6.0% in the Cromford® Market Index
for the 17 cities, significantly more positive than the 2.0% increase we recorded last week. The means the trend in
favor of sellers is starting to accelerate.
Fountain Hills, Surprise, Glendale, Queen Creek and Gilbert are seeing the biggest improvement of 11% or more.
9 out of 17 cities are now seller's markets. We have 4 cities that are balanced and 4 that are buyer's markets.
Maricopa is still trailing but it is starting a recovering trend having hit a low of 63.7 on December 25.
The very mild optimism that was the order of the day in December is starting to look well-justified. We recommend
mild to moderate optimism for the month of January, at least as far as the market balance is concerned. Transaction
volumes remain subdued but are more likely to recover if the market balance stays favorable to sellers.
2 Year Change in Annual Average $/SF – Closed Listing – SFRs
Jan 10 - Expanding on yesterday's observation, the bar chart below ranks the cities by the 2-year change in the
annual average price per square foot for closed listings, measured at the end of 2023.
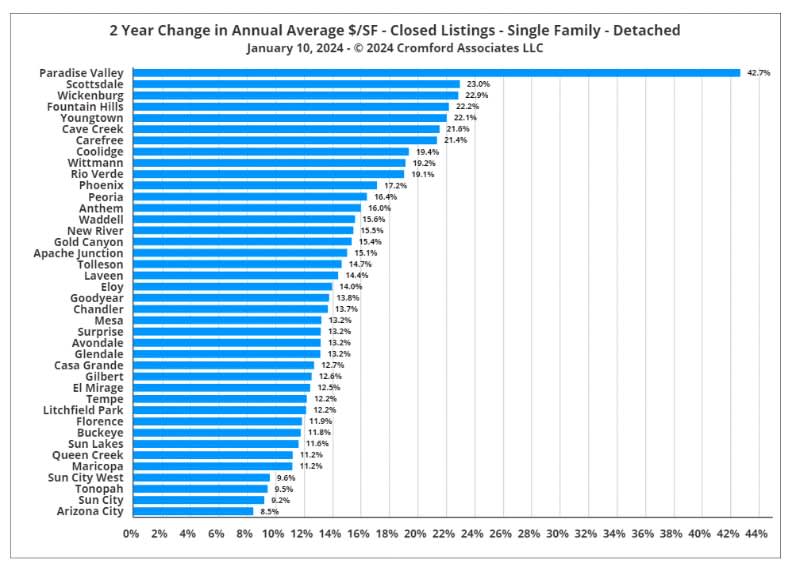
Paradise Valley is way out in front with an increase of over 42%. Other cities with a healthy proportion of luxury
homes appear close to the top, including Scottsdale, Fountain Hills, Cave Creek, Carefree and Rio Verde.
Arizona City prices have risen the least - though still up 8.5% over the 2 years. The 55+ areas were also slower
movers, with Sun City, Sun City West, and Sun Lakes all below 12%.
The outer areas are a mixed bag, with Wickenburg, Coolidge, Wittmann, Rio Verde, Anthem, Waddell and New
River all in the upper ranges. In contrast Arizona City, Tonopah, Queen Creek, Buckeye and Florence did relatively
poorly.
This is the first time since 2000 that we have seen Paradise Valley accelerate well ahead of the pack. It probably
has something to do with the number of homes that are torn down and replaced with new builds that have extremely
high costs per square foot. This process extends the gap between Paradise valley and Scottsdale home pricing.
Change in Annual Average Price per Sq Ft by List Price
Jan 9 - Throughout the last year it has become more and more obvious that the top-end of the market is behaving differently from the entry-level and the mid-range.
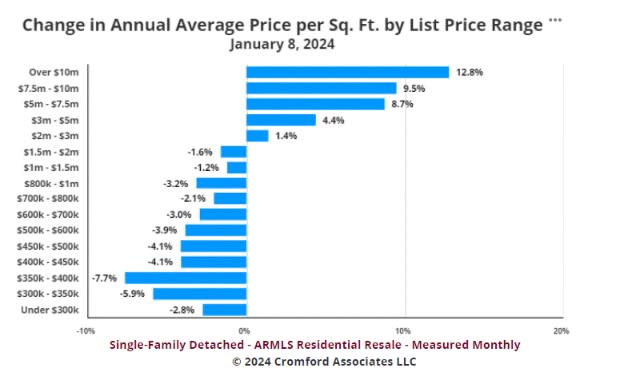
Using a long-term average smooths out the data, a very necessary thing for studying the high-end where sample
sizes are very low. For example, there were no sales over £10 million in December, so the sample set was null for
that month.
Above $2,000,000 we see that the annual average $/SF is higher than a year ago, but below $2,000,000 it is lower.
The cheaper you go the more 12-month average prices tend to have fallen.
Homes above $10 million have become more expensive and at the fastest rate. Homes between $300,000 and
$400,000 have seen their annual average $/SF drop over the last month by more than other price ranges.
We rarely see such a clear pattern, so I conclude that something is bolstering the luxury market. It is not lack of
supply, which is plentiful, although active listing counts are not excessive compared to the normal levels at these
altitudes. It seems that luxury buyers have been less affected by the high interest rates which appear to have had
a much more serious effect on first-time home buyers.