
Market Statistics Report for January 17, 2024
Market Dashboard
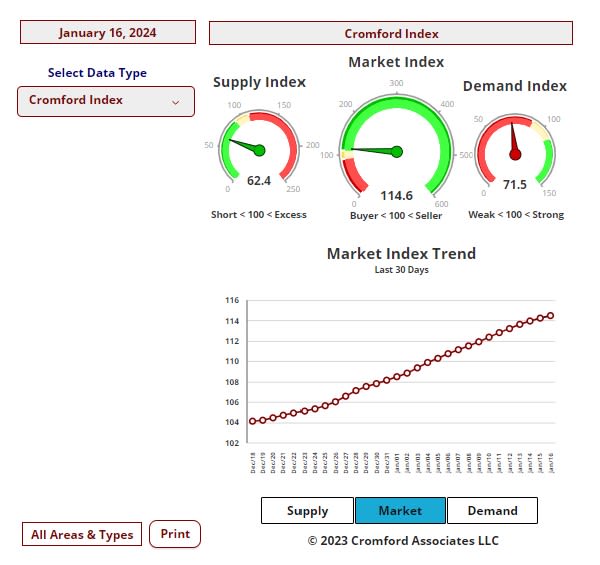
This Dashboard provides a comprehensive summary of the current state of the overall residential resale market.
All the statistics shown are for the entire Arizona Regional area as defined by ARMLS. All residential resale transactions
recorded by ARMLS are included. Geographically, this includes Maricopa county, a large part of Pinal county and a small
part of Yavapai county. In addition, "out of area" listings recorded on ARMLS are included, although these usually
constitute a very small percentage of total sales and have very little effect on the data.
All dwelling types are included. For-sale-by-owner, auctions and other non-MLS transactions are not included. Land,
commercial units, and multiple dwelling units are also excluded.
Daily Market Snapshot – City Ranking
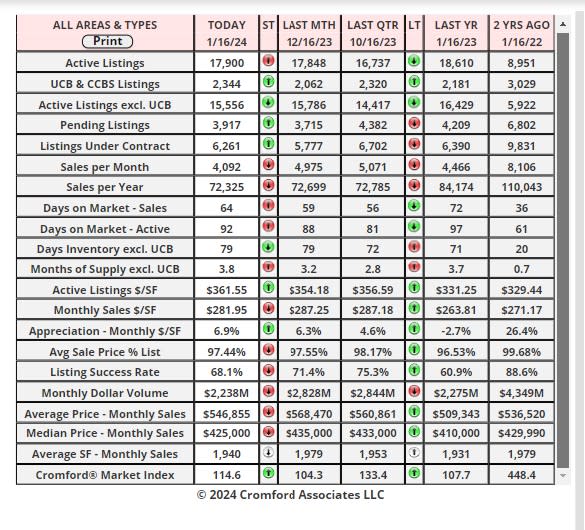
The table below provides a concise statistical summary of today's residential resale market in the Phoenix metropolitan
area. The figures shown are for the entire Arizona Regional area as defined by ARMLS. All residential resale transactions
recorded by ARMLS are included. Geographically, this includes Maricopa county, the majority of Pinal county and a small
part of Yavapai county. In addition, "out of area" listings recorded in ARMLS are included, although these constitute a very
small percentage (typically less than 1%) of total sales and have very little effect on the statistics.
Market Index
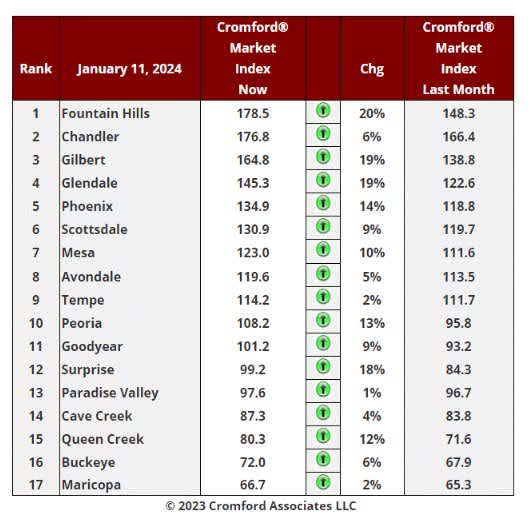
Jan 11 - Here is our latest table of Cromford® Market Index values for the single-family markets in the 17
largest cities.
Market Index Commentary
In a development that will bring joy to sellers and dismay to housing-crash forecasters, all 17 cities are now
showing an increase in their Cromford® Market Index over the past month.
There has been an average increase of 10% in the Cromford® Market Index for the 17 cities, significantly
more positive than the 6% increase we recorded last week. The trend in favor of sellers is accelerating as
listings go under contract at a faster rate and supply remains well below normal.
Leading the charge are Fountain Hills, Gilbert, Glendale and Surprise. The laggards include Tempe,
Maricopa, Cave Creek, Avondale, Buckeye and Paradise Valley, but even these are now improving for
sellers.
9 out of 17 cities are seller's markets. We have 4 cities that are balanced and 4 that remain buyer's markets.
Last week we recommended mild to moderate optimism for the month of January, and this can be modified
to remove the reference to mild. It is a good start to the year and transaction volumes appear likely to start
improving if this trend holds. We will be examining annual sales counts and looking for stability followed by a
gentle increase.
.
January 15 – Mid Month Pricing Update
Each month about this time we look back at the previous month, analyze how pricing has behaved and report
on how well our forecasting techniques performed. We also give a forecast for how pricing will move over the
next month.
For the monthly period ending January 15, we are currently recording a sales $/SF of $285.03 averaged for
all areas and types across the ARMLS database. This is down 0.3% from the $285.81 we now measure for
December 15. Our forecast range mid-point was $294.38, so instead of a bounce back as we forecast, there
was little movement in pricing between December and January. The actual result sits well below our 90%
confidence range for the second month in a row. Forecasting for 4 weeks out has been extremely challenging
with such low transaction volumes and a frequently changing sales mix. Undeterred, we grit our teeth and
plow on.
On January 15 the pending listings for all areas & types show an average list $/SF of $335.80, up 1.9% from
the reading for December 15. Among those pending listings we have 99.1% normal, 0.3% in REOs and 0.7%
in short sales and pre-foreclosures. This is similar to the last 10 months though we are continuing to see a
handful of short sales from people who purchased at the height of the 2022 price wave and have since faced
financial difficulty.
Our mid-point forecast for the average monthly sales $/SF on February 15 is $289.77, which is 1.7% above
the January 15 reading. We have 90% confidence that it will fall within ± 2% of this midpoint, i.e. in the range
$283.97 to $295.57.
The average $/SF for closed listings has been trending down for the last two months from an unusually high
November reading. However, the average $/SF both for pending listings and for listings under contract has
been moving higher. We assert that these two trends cannot go in opposite directions for a prolonged time.
Either the closed prices have to rise of the pending and under contract prices have to fall. We think the closed
prices are more likely to start to move higher under the current market conditions.