
Market Statistics Report for
January 2nd, 2024
Market Dashboard
This Dashboard provides a comprehensive summary of the current state of the overall residential resale market.
All the statistics shown are for the entire Arizona Regional area as defined by ARMLS. All residential resale transactions
recorded by ARMLS are included. Geographically, this includes Maricopa county, a large part of Pinal county and a small
part of Yavapai county. In addition, "out of area" listings recorded on ARMLS are included, although these usually
constitute a very small percentage of total sales and have very little effect on the data.
All dwelling types are included. For-sale-by-owner, auctions and other non-MLS transactions are not included. Land,
commercial units, and multiple dwelling units are also excluded.
All the statistics shown are for the entire Arizona Regional area as defined by ARMLS. All residential resale transactions
recorded by ARMLS are included. Geographically, this includes Maricopa county, a large part of Pinal county and a small
part of Yavapai county. In addition, "out of area" listings recorded on ARMLS are included, although these usually
constitute a very small percentage of total sales and have very little effect on the data.
All dwelling types are included. For-sale-by-owner, auctions and other non-MLS transactions are not included. Land,
commercial units, and multiple dwelling units are also excluded.
Daily Market Snapshot – City Ranking
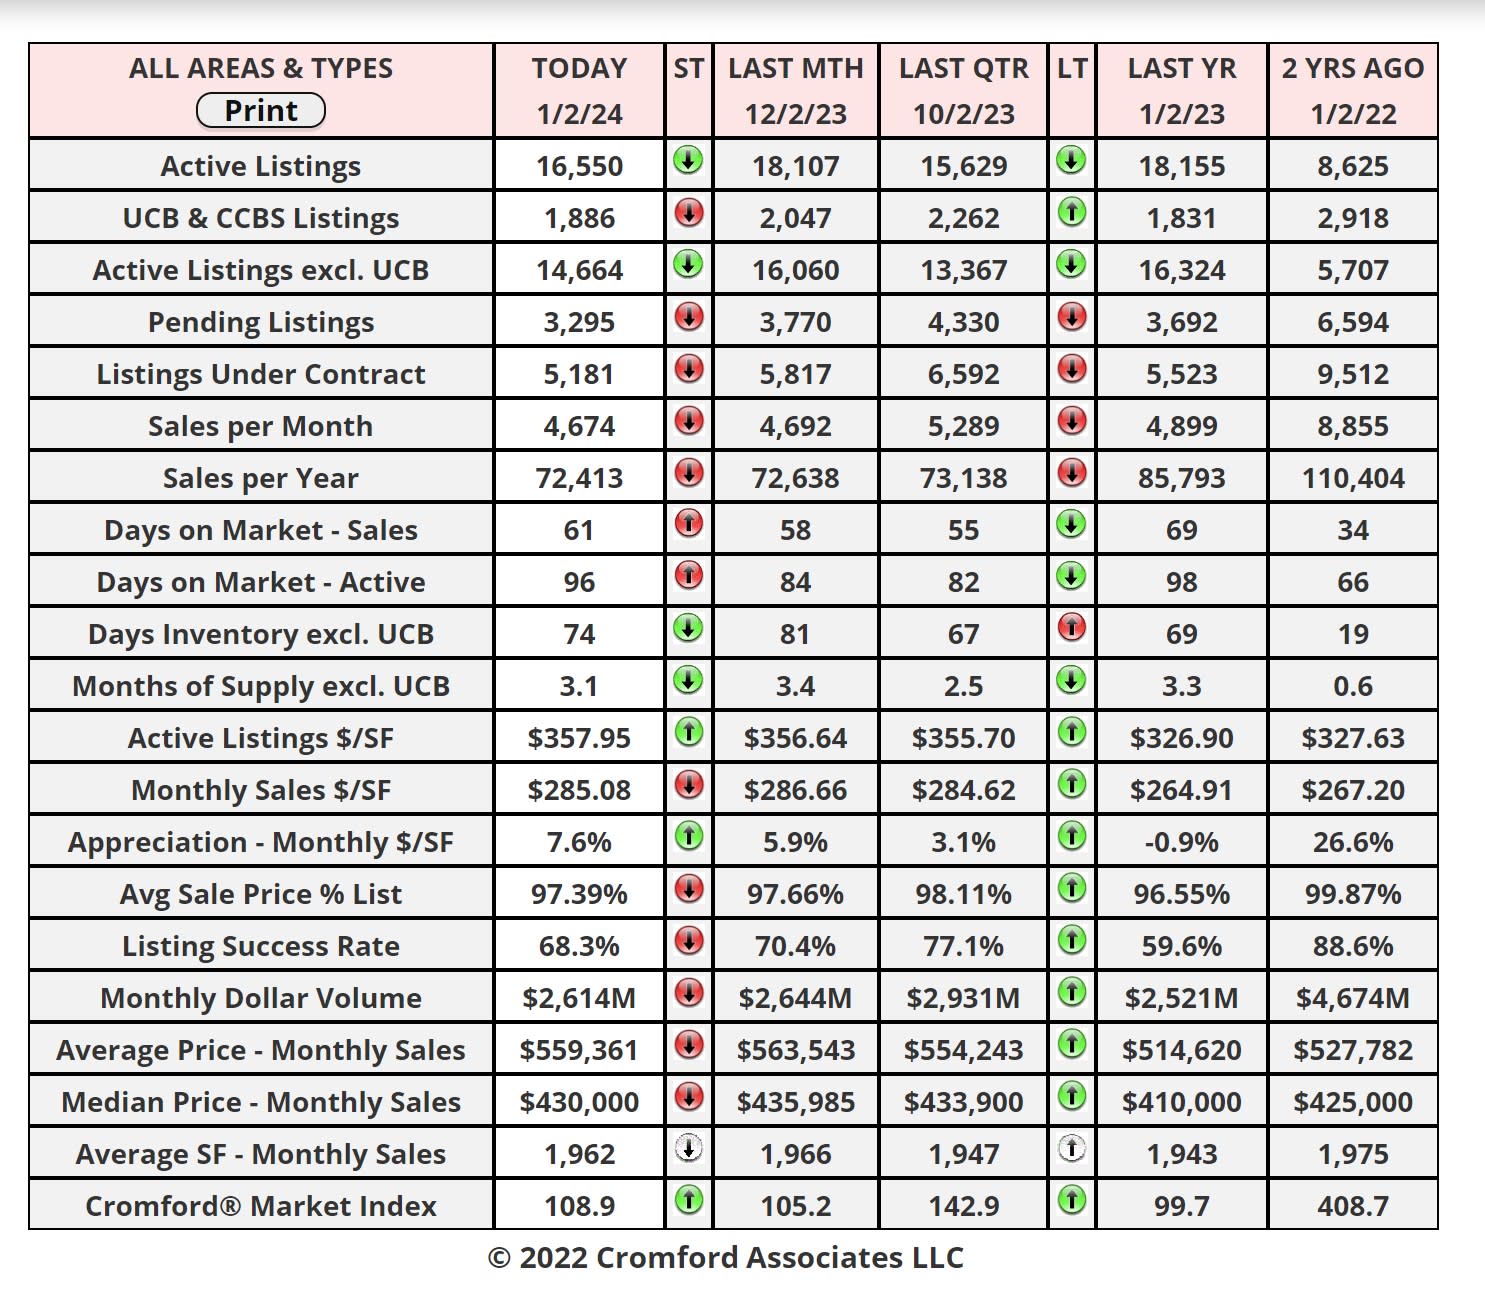
The table below provides a concise statistical summary of today's residential resale market in the Phoenix metropolitan
area. The figures shown are for the entire Arizona Regional area as defined by ARMLS. All residential resale transactions
recorded by ARMLS are included. Geographically, this includes Maricopa county, the majority of Pinal county and a small
part of Yavapai county. In addition, "out of area" listings recorded in ARMLS are included, although these constitute a very
small percentage (typically less than 1%) of total sales and have very little effect on the statistics.
area. The figures shown are for the entire Arizona Regional area as defined by ARMLS. All residential resale transactions
recorded by ARMLS are included. Geographically, this includes Maricopa county, the majority of Pinal county and a small
part of Yavapai county. In addition, "out of area" listings recorded in ARMLS are included, although these constitute a very
small percentage (typically less than 1%) of total sales and have very little effect on the statistics.
Market Index
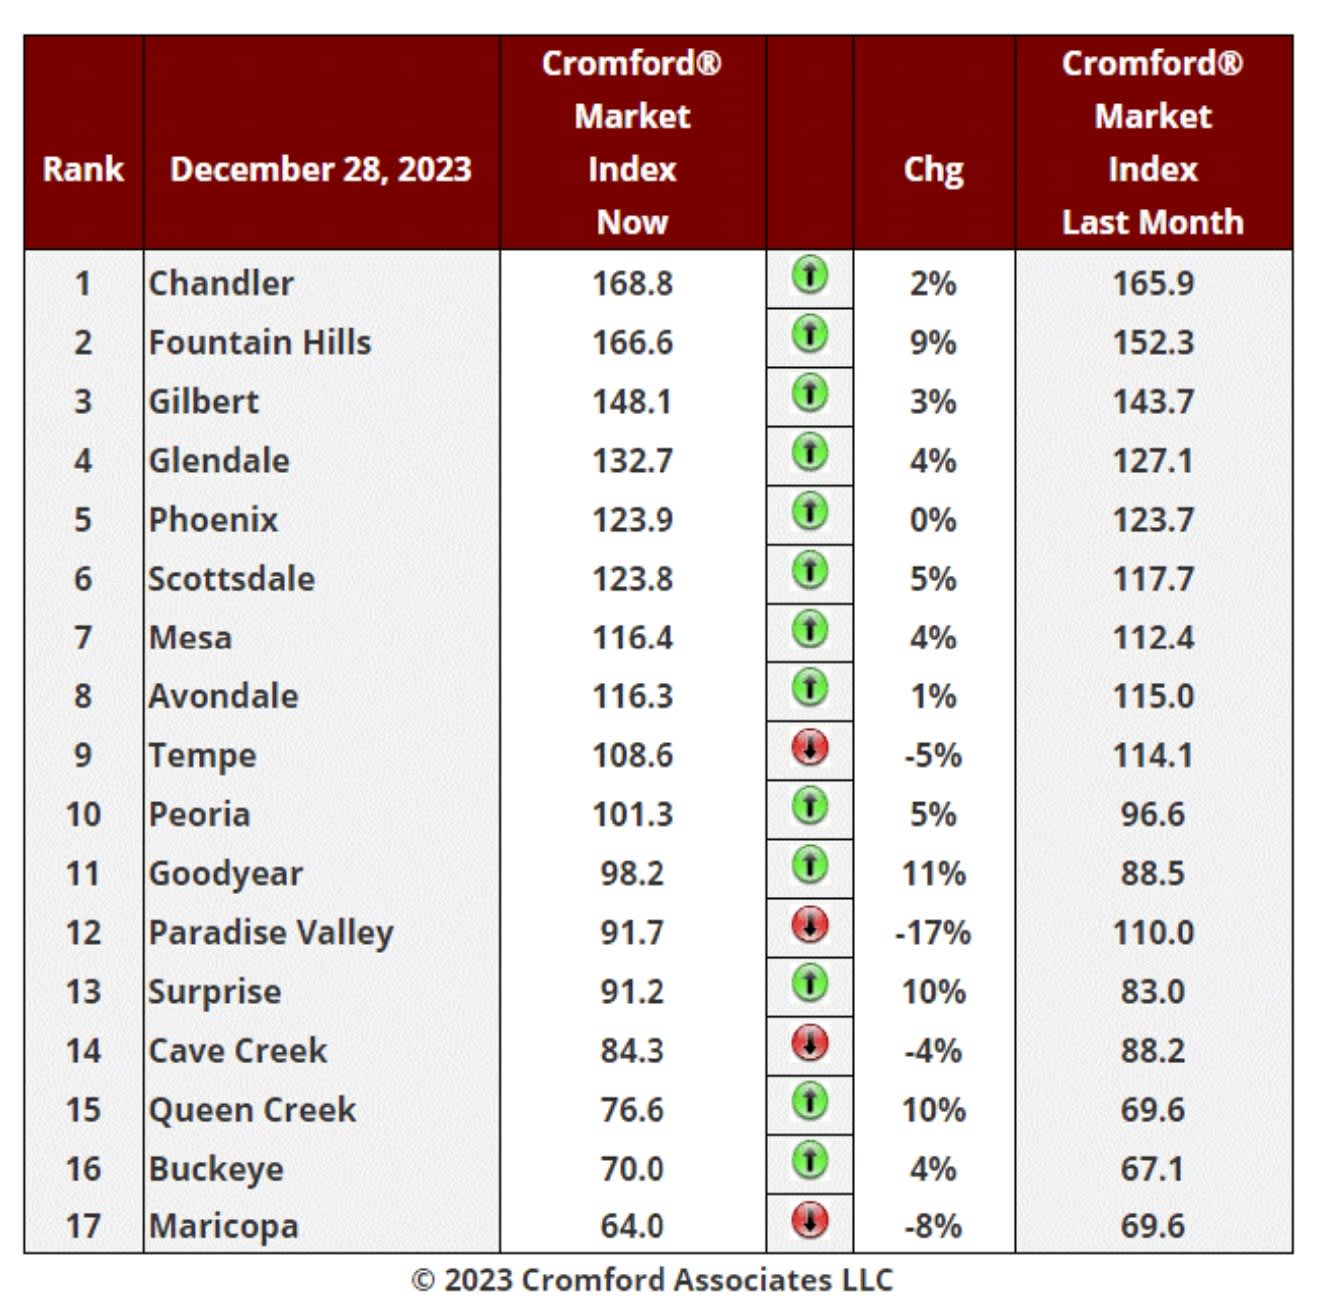
Dec 28 - Here is our latest table of Cromford® Market Index values for the single-family markets in the 17
largest cities.
largest cities.
Market Index Commentary
The table is now dominated by green with 13 cities seeing their Cromford Market Index increase since November
28. There has been an average increase of 2.0% in the Cromford® Market Index for the 17 cities, significantly more
positive than the 3.0% decline we recorded last week, confirming the trend in favor of sellers.
Only Paradise Valley, Tempe, Cave Creek and Maricopa are still showing declines over the last month with
Goodyear, Surprise and Queen Creek seeing the biggest improvement of 10% or more.
8 out of 17 cities are now seller's markets. We have 5 cities that are balanced and 4 that are buyer's markets.
Maricopa is still trailing but appears have turned around, having hit a low of 63.7 on December 25.
Current Commentary
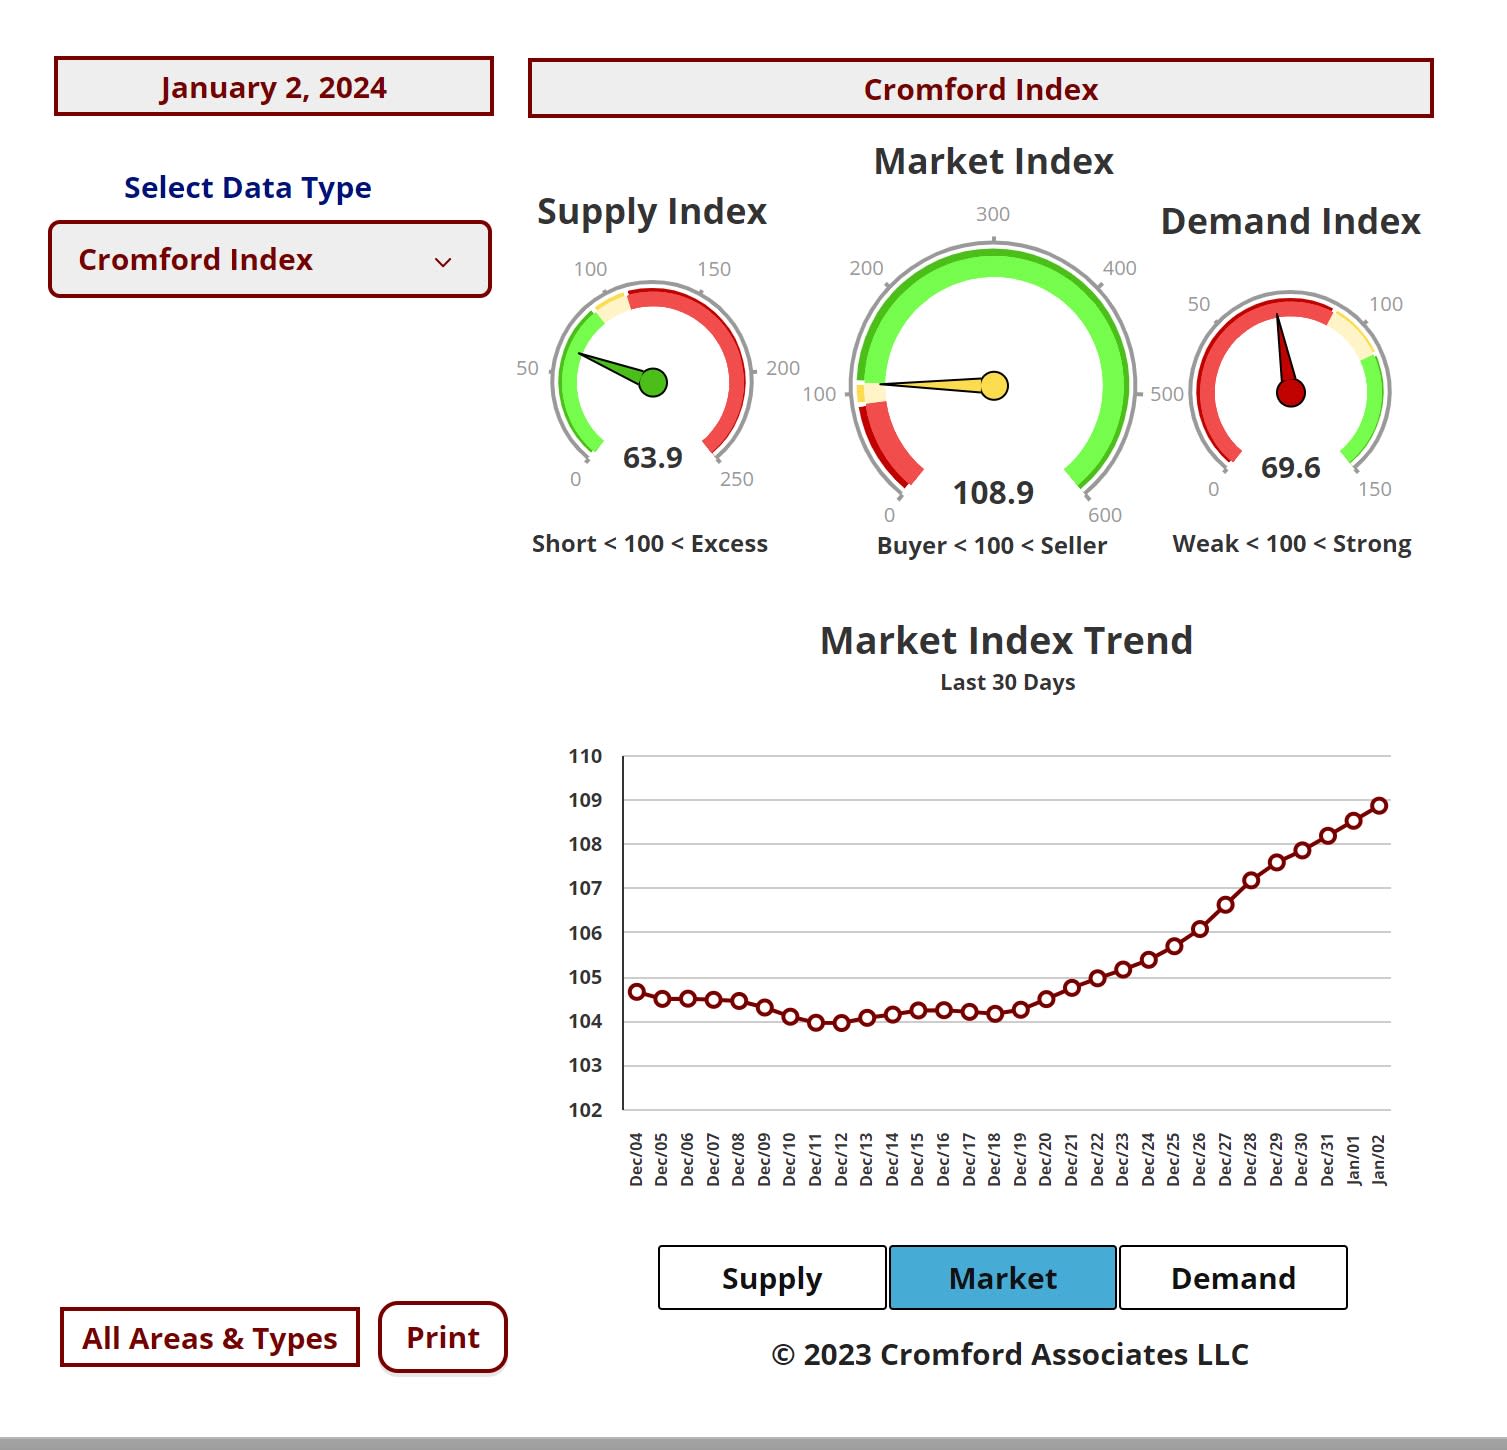
Jan 1 - The Cromford® Market Index is moving higher, partly because the count of active listings declined during
December (as expected) and partly because there is a slight increase in demand. This increase in demand is very
muted, however. We did see a small upward move in the closing rate over the last 2 weeks but there has also been
a large fall in the number of listings under contract. This is because the closings have taken a big chunk out of the
pipeline that has not been replaced by new contract signings.
We are starting 2024 with one of the lowest counts of listings under contract we have ever recorded for the start of
any year (5,127). We measured 5,456 last year and 9,393 in 2022. We have to go back all the way to the dark days
of 2008 to find a lower count (3,468). 2007 was also very bad, but at 5,197 it just beats the 2024 reading.
With interest rates much lower than 2 months ago, we may start to see more accepted contract activity in the next
few weeks. We normally get a lot of new listings in January too, so at this stage it is too early to tell whether supply
or demand will grow the fastest. The next 3 weeks will be very important in establishing which trend is
dominant.