
Market Statistics Report for January 24, 2024
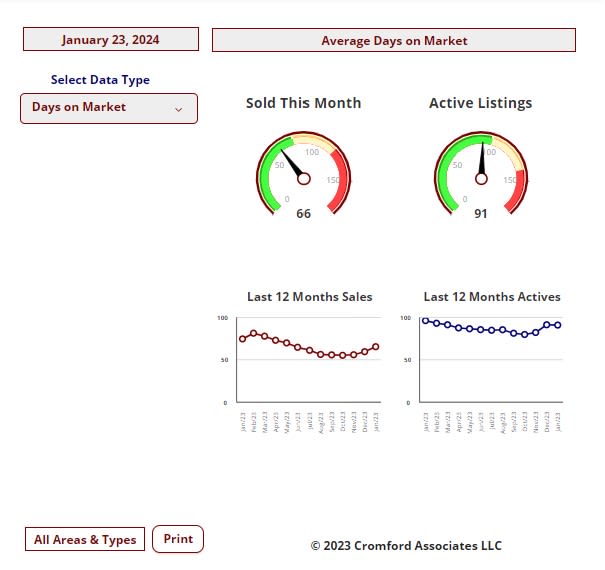
Market Dashboard - DOM
This Dashboard provides a comprehensive summary of the current state of the overall residential resale market.
All the statistics shown are for the entire Arizona Regional area as defined by ARMLS. All residential resale transactions
recorded by ARMLS are included. Geographically, this includes Maricopa county, a large part of Pinal county and a small
part of Yavapai county. In addition, "out of area" listings recorded on ARMLS are included, although these usually
constitute a very small percentage of total sales and have very little effect on the data.
All dwelling types are included. For-sale-by-owner, auctions and other non-MLS transactions are not included. Land,
commercial units, and multiple dwelling units are also excluded.
Daily Market Snapshot – City Ranking
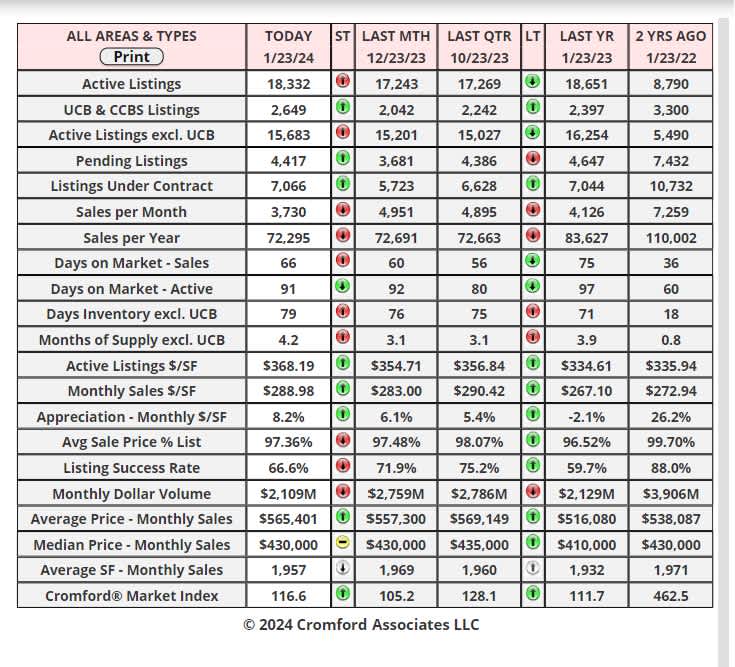
The table below provides a concise statistical summary of today's residential resale market in the Phoenix metropolitan
area. The figures shown are for the entire Arizona Regional area as defined by ARMLS. All residential resale transactions
recorded by ARMLS are included. Geographically, this includes Maricopa county, the majority of Pinal county and a small
part of Yavapai county. In addition, "out of area" listings recorded in ARMLS are included, although these constitute a very
small percentage (typically less than 1%) of total sales and have very little effect on the statistics.
Market Index
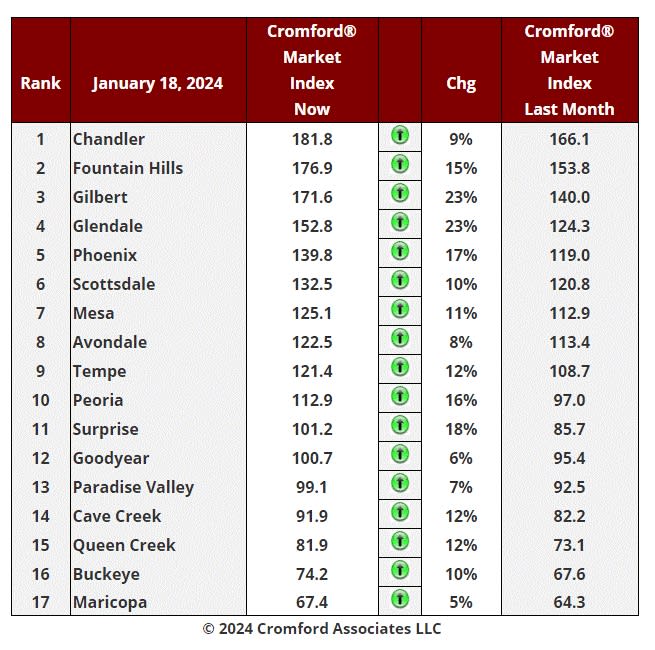
Jan 18 - Here is our latest table of Cromford® Market Index values for the single-family markets in the 17
largest cities.
Market Index Commentary
Another all-green chart with 17 cities showing an increase in their Cromford® Market Index over the past month.
There has been an average increase of 12.6% in the Cromford® Market Index for the 17 cities, a rapid rise and
even more positive than the 10% increase we recorded last week. The implication is that the drop-in interest rates
started in October is finally bringing more offers for homes listed for sale. As is normal in January, new listings are
also arriving in stronger numbers, but the total supply remains well below normal. In addition, the demand appears
to rising at a significantly faster rate than the supply.
Leading the pack this week are Gilbert, Glendale, Surprise, Phoenix and Peoria. The laggards include Maricopa,
Goodyear and Paradise Valley, but even these are higher than last week.
10 out of 17 cities are seller's markets. We have 4 cities that are balanced and only 3 that remain buyer's markets,
with Cave Creek escaping that zone over the last week.
Sales volume remains very low, but closings are always very weak in January due to the dearth of new contract
signings in December. The precursor of a recovery is strong growth in new contracts. These numbers are by no
means amazing but they do seem to be increasing at a healthy pace and in a pattern reminiscent of a normal
sellers' market. Moderate optimism seems to be in order, and this is reflected in the most recent home builder
confidence survey. The NAHB / Wells Fargo Housing Market Index has jumped from a very weak 34 in November
to 37 in December and 44 in January. A year ago, it stood at only 31, so home builder sentiment is trending higher
fast but is yet to reach the heights of last Summer when it stood in the mid-50s.
January – Average List Price and Contract Ratio
Jan 21 - The average price per square foot of active listings just hit a new all-time high of $366.43 yesterday. This
surpassed previous peaks set in May 2022 and June 2023.
Active listings are arriving in much larger numbers than last year, when they were unusually scarce. The new listing
arrival rate is back to normal, but the seller's expectations seem to be unusually positive, judging by the asking
prices. The average $/SF has risen 2.1% in just the last two weeks. These figures are averaged across all areas &
dwelling types.
Jan 20 - A few cities have seen a sharp rise in their contract ratio over the past 2 weeks. The percentage increases
for single-family detached homes are shown in the table below:
1. Apache Junction +64% to 94
2. Anthem +47% to 71
3. Arizona City +47% to 57
4. Gilbert +46% to 65
5. Sun Lakes +45% to 59
6. Chandler +43% to 72
7. Tempe +31% to 53
8. Peoria +31% to 49
9. Gold Canyon +30% to 32
These are the locations that have experienced the most rapid improvement in demand versus supply.
A handful have gone backwards:
1. Fountain Hills - down 11% to 36
2. Laveen - down 15% to 67
3. Goodyear - down 7% to 33
4. Sun City West - down 5% to 36
Phoenix is up 18% to 48.
In most areas, a contract ratio over 40 is consistent with a seller's market. More expensive locations tend to have
lower contract ratios, so Paradise is only 21, (up 20%), while Scottsdale is 30 (up 15%).
The contract ratio is one of the leading indicators of a change in the market.