
Market Statistics Report for July 12, 2024
Market Dashboard – Dashboard
This Dashboard provides a comprehensive summary of the current state of the overall residential resale market.
All the statistics shown are for the entire Arizona Regional area as defined by ARMLS. All residential resale transactions
recorded by ARMLS are included. Geographically, this includes Maricopa County, a large part of Pinal county and a small
part of Yavapai county. In addition, "out of area" listings recorded on ARMLS are included, although these usually
constitute a very small percentage of total sales and have very little effect on the data.
All dwelling types are included. For-sale-by-owner, auctions and other non-MLS transactions are not included. Land,
commercial units, and multiple dwelling units are also excluded.
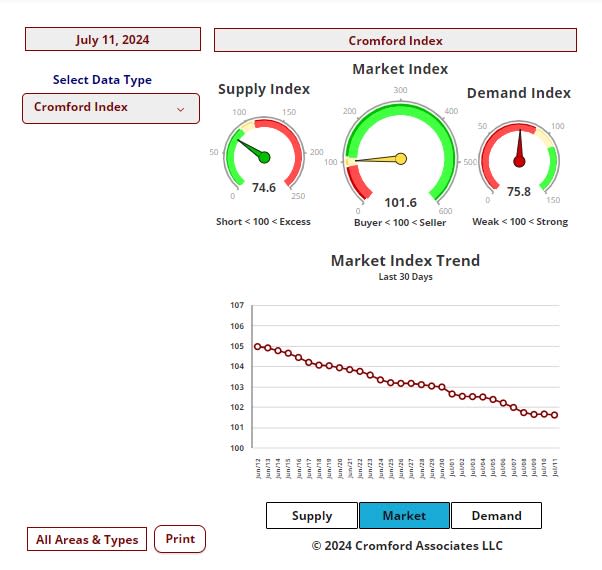
Daily Market Snapshot
The table below provides a concise statistical summary of today's residential resale market in the Phoenix metropolitan
area. The figures shown are for the entire Arizona Regional area as defined by ARMLS. All residential resale transactions
recorded by ARMLS are included. Geographically, this includes Maricopa county, the majority of Pinal county and a small
part of Yavapai county. In addition, "out of area" listings recorded in ARMLS are included, although these constitute a very
small percentage (typically less than 1%) of total sales and have very little effect on the statistics.
Cromford Market Index
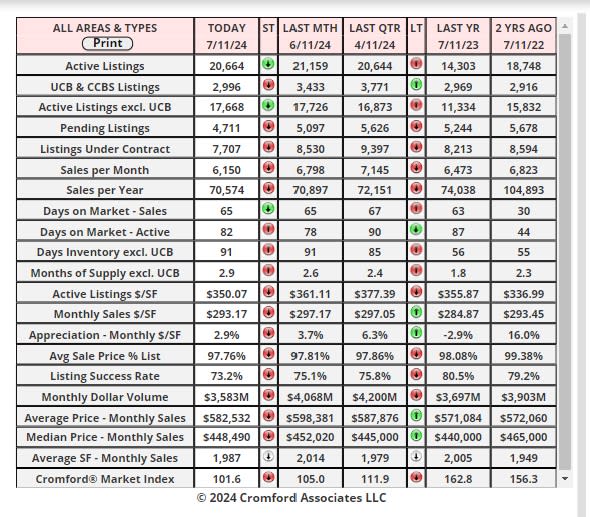
July 11 - Here is our latest table of Cromford® Market Index values for the single-family markets in the 17 largest
cities.
Cromford Market Index Commentary
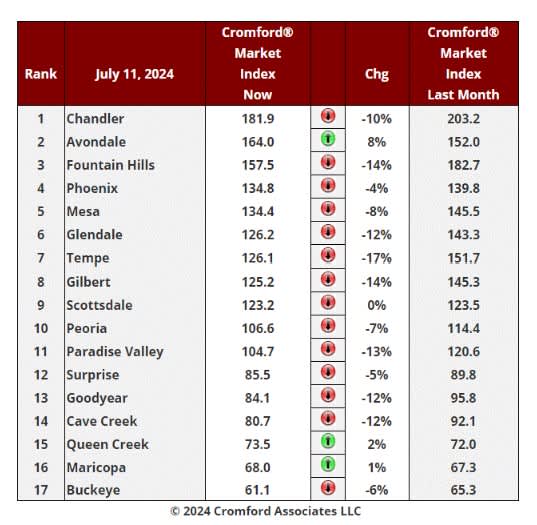
The average change in CMI over the past month is -7.2%, a larger fall than the -6.9% we saw last week. However,
the rate of decline is slowing. In other words, a -0.3% change is better than the -0.8% we measured last week. If
this trend is repeated, then we could see the monthly deterioration reduce fairly soon.
As we saw during the previous 2 weeks, we only have 3 cities showing an increase in their Cromford® Market
Index over the past month, while 14 have declined. The 3 improving are the same as last week, but only Avondale
has improved by a decent percentage.
We have a long list of cities that moved substantially in favor of buyers: Tempe, Gilbert, Fountain Hills, Paradise
Valley, Goodyear, Cave Creek, Glendale and Chandler.
9 out of 17 cities remain seller's markets over 110. We have 2 cities that are balanced, while the remaining 6 are
buyer's markets. However, only 3 remain over 140.
Not much has changed since last week and although the market is close to balance there is currently little sign that
it will deteriorate to the point where we have a buyer's market overall.
The benign CPI data released this week has had a relatively small downward effect on mortgage rates, but a
supercharged upward effect on the share prices of home builders. For example, KB Home rose more than 10% in
hope of improved market conditions if the Federal Reserve starts to lower rates.
Overall supply looks like it is levelling off, bringing an end to the upward trend that has been in place since the
beginning of the year. Without an excess of inventory, any improvement in demand caused by falling interest rates
could translate to the CMI changing direction. However, this is currently just a possibility and yet to be proven. We
will certainly be reporting on it should we find solid evidence. Stay tuned.
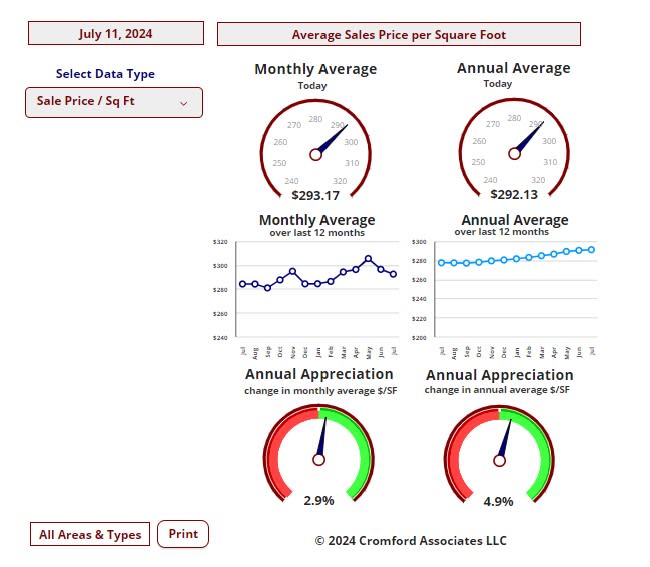
Cromford Market Index – Sale Price / Sq Ft
Contract Ratios – Single Family Detached
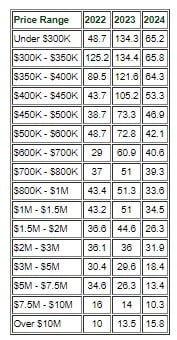
Jul 8 - We have been studying the contract ratios for various price ranges and comparing the readings on July 1
2024 with those for the same date in 2023 and 2022.
These numbers are for the single-family detached segment.
In July 2022 the rapid rise in interest rates had caused panic to rush through the market and contract ratios had
collapsed from much higher June 2022 levels. The low to mid price ranges were worst affected.
By July 2023 the market had recovered to a remarkable degree and the low supply drove contract ratios back to
hotter levels, especially at the lowest end of the market.
In July 2024, we are back to a softer market, with supply and demand in balance. Some price ranges are stronger
than they were 2 years ago - for example Under $300K and $400K - $500K, but most are weaker than in 2022.
We note that the segment over $10m is unique in that it is hotter than it was last year and the year before. But
between $800K and $10M the luxury price ranges are much cooler than in both prior years.