
Market Statistics Report for July 18, 2024
Market Dashboard – Dashboard
This Dashboard provides a comprehensive summary of the current state of the overall residential resale market.
All the statistics shown are for the entire Arizona Regional area as defined by ARMLS. All residential resale transactions
recorded by ARMLS are included. Geographically, this includes Maricopa County, a large part of Pinal county and a small
part of Yavapai county. In addition, "out of area" listings recorded on ARMLS are included, although these usually
constitute a very small percentage of total sales and have very little effect on the data.
All dwelling types are included. For-sale-by-owner, auctions and other non-MLS transactions are not included. Land,
commercial units, and multiple dwelling units are also excluded.
Daily Market Snapshot
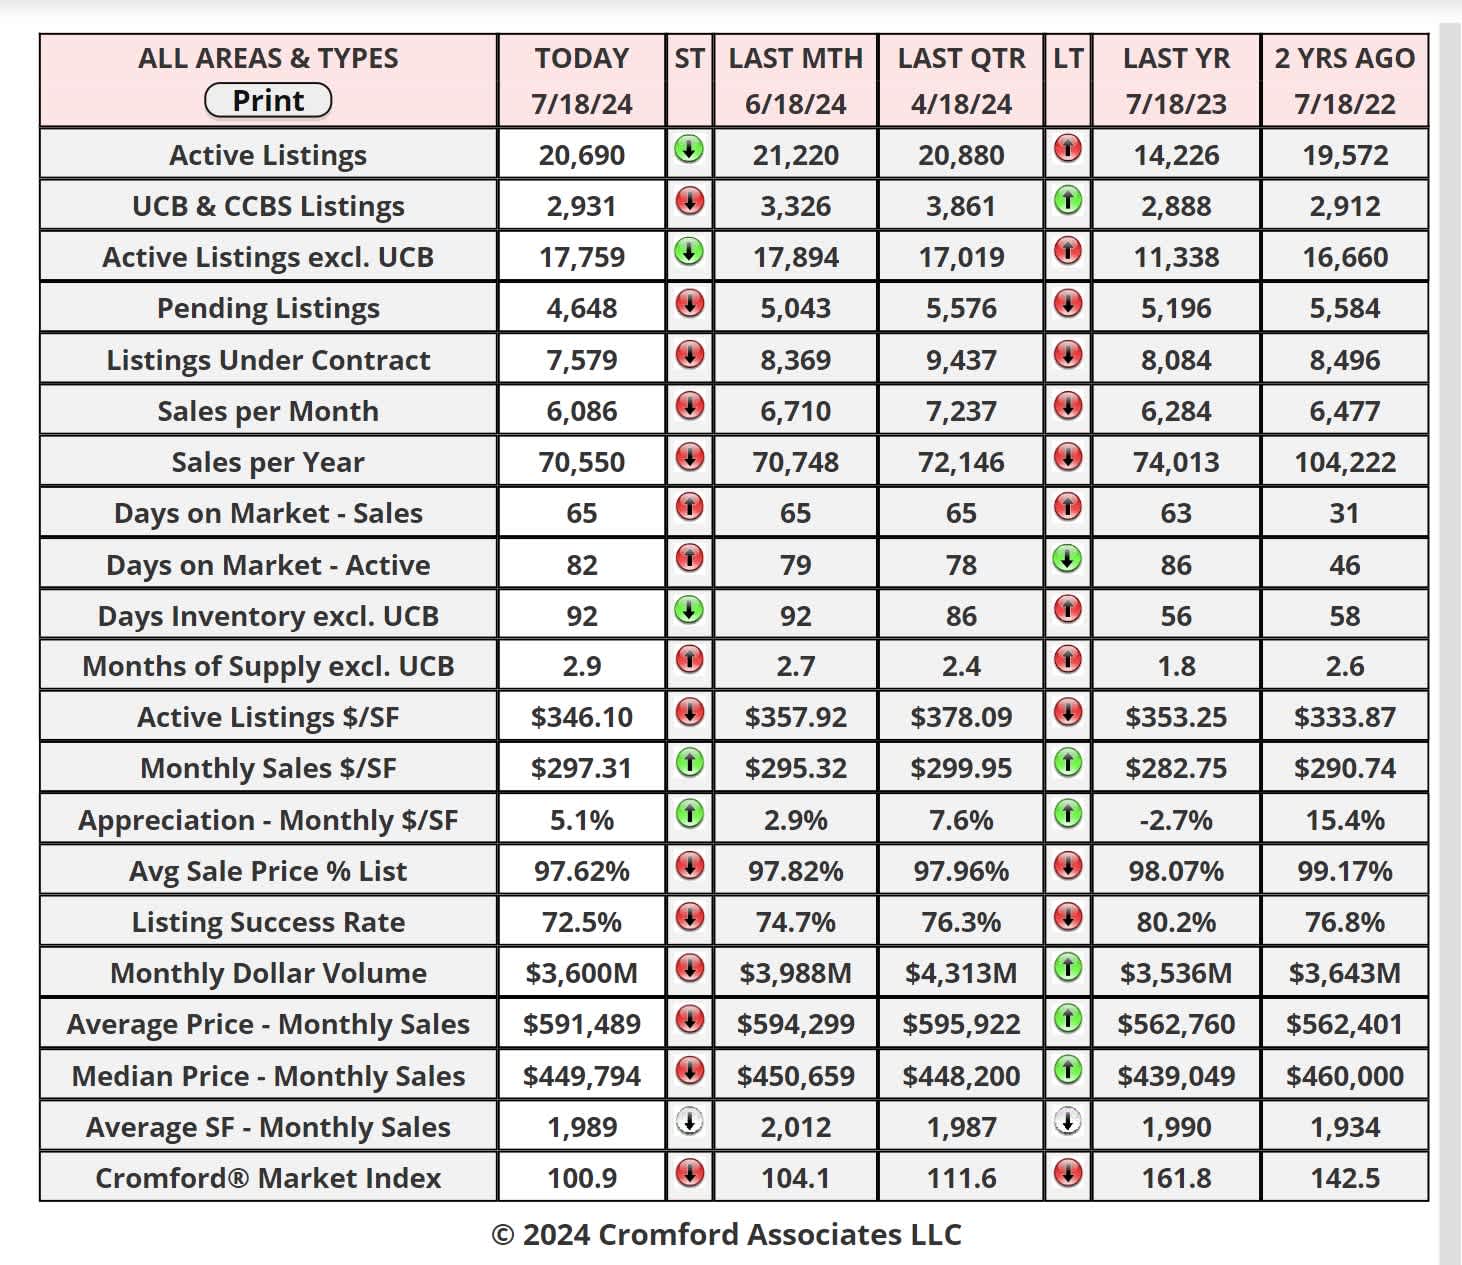
The table below provides a concise statistical summary of today's residential resale market in the Phoenix metropolitan
area. The figures shown are for the entire Arizona Regional area as defined by ARMLS. All residential resale transactions
recorded by ARMLS are included. Geographically, this includes Maricopa county, the majority of Pinal county and a small
part of Yavapai county. In addition, "out of area" listings recorded in ARMLS are included, although these constitute a very
small percentage (typically less than 1%) of total sales and have very little effect on the statistics.
Cromford Market Index
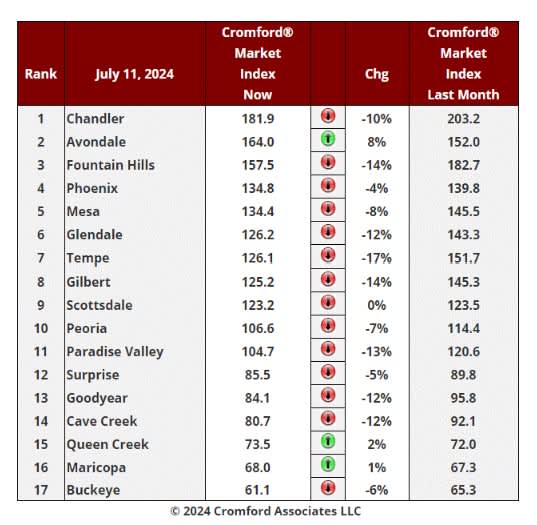
July 11 - Here is our latest table of Cromford® Market Index values for the single-family markets in the 17 largest
cities.
Cromford Market Index Commentary
The average change in CMI over the past month is -7.2%, a larger fall than the -6.9% we saw last week. However,
the rate of decline is slowing. In other words, a -0.3% change is better than the -0.8% we measured last week. If
this trend is repeated, then we could see the monthly deterioration reduce fairly soon.
As we saw during the previous 2 weeks, we only have 3 cities showing an increase in their Cromford® Market
Index over the past month, while 14 have declined. The 3 improving are the same as last week, but only Avondale
has improved by a decent percentage.
We have a long list of cities that moved substantially in favor of buyers: Tempe, Gilbert, Fountain Hills, Paradise
Valley, Goodyear, Cave Creek, Glendale and Chandler.
9 out of 17 cities remain seller's markets over 110. We have 2 cities that are balanced, while the remaining 6 are
buyer's markets. However, only 3 remain over 140.
Not much has changed since last week and although the market is close to balance there is currently little sign that
it will deteriorate to the point where we have a buyer's market overall.
The benign CPI data released this week has had a relatively small downward effect on mortgage rates, but a
supercharged upward effect on the share prices of home builders. For example, KB Home rose more than 10% in
hope of improved market conditions if the Federal Reserve starts to lower rates.
Overall supply looks like it is levelling off, bringing an end to the upward trend that has been in place since the
beginning of the year. Without an excess of inventory, any improvement in demand caused by falling interest rates
could translate to the CMI changing direction. However, this is currently just a possibility and yet to be proven. We
will certainly be reporting on it should we find solid evidence. Stay tuned.
Cromford Market Index – Sale Price / Sq Ft
Active Listing Counts & Commentary
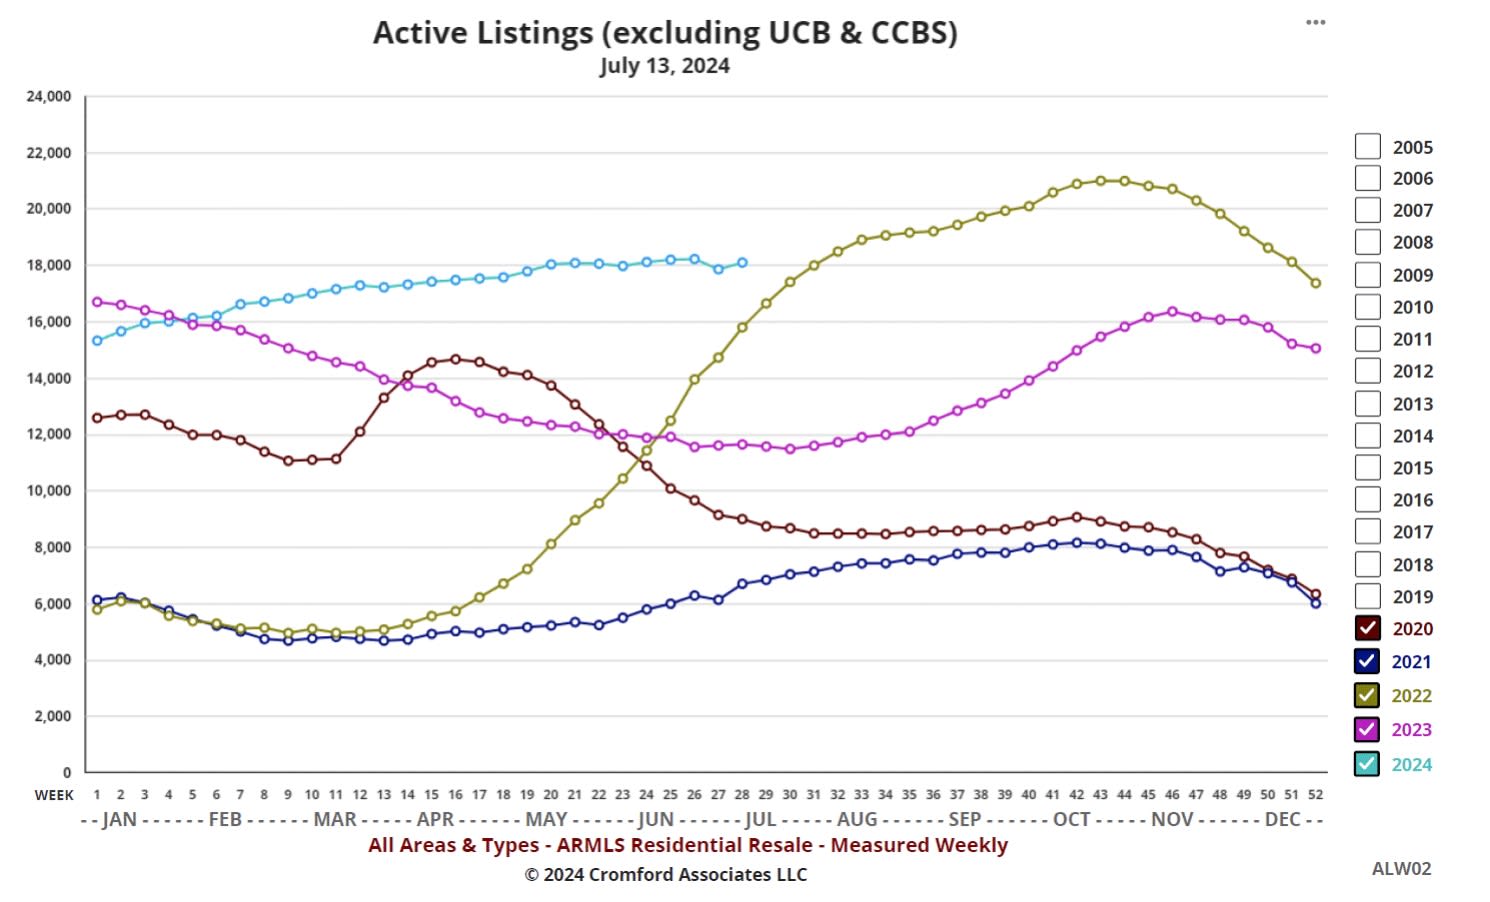
Jul 13 - The number of active listings had been rising since the start of the year but since May has reached a
plateau, as can be seen in the turquoise line above:
The number is struggling to reach much beyond 18,000, which is about 75% of what we would consider normal.
Meanwhile demand is continuing to fall and is almost 25% below what we would consider normal.
The combination of these means weak supply and weak demand are almost exactly in balance and the only
detectable trend is demand weakening further.
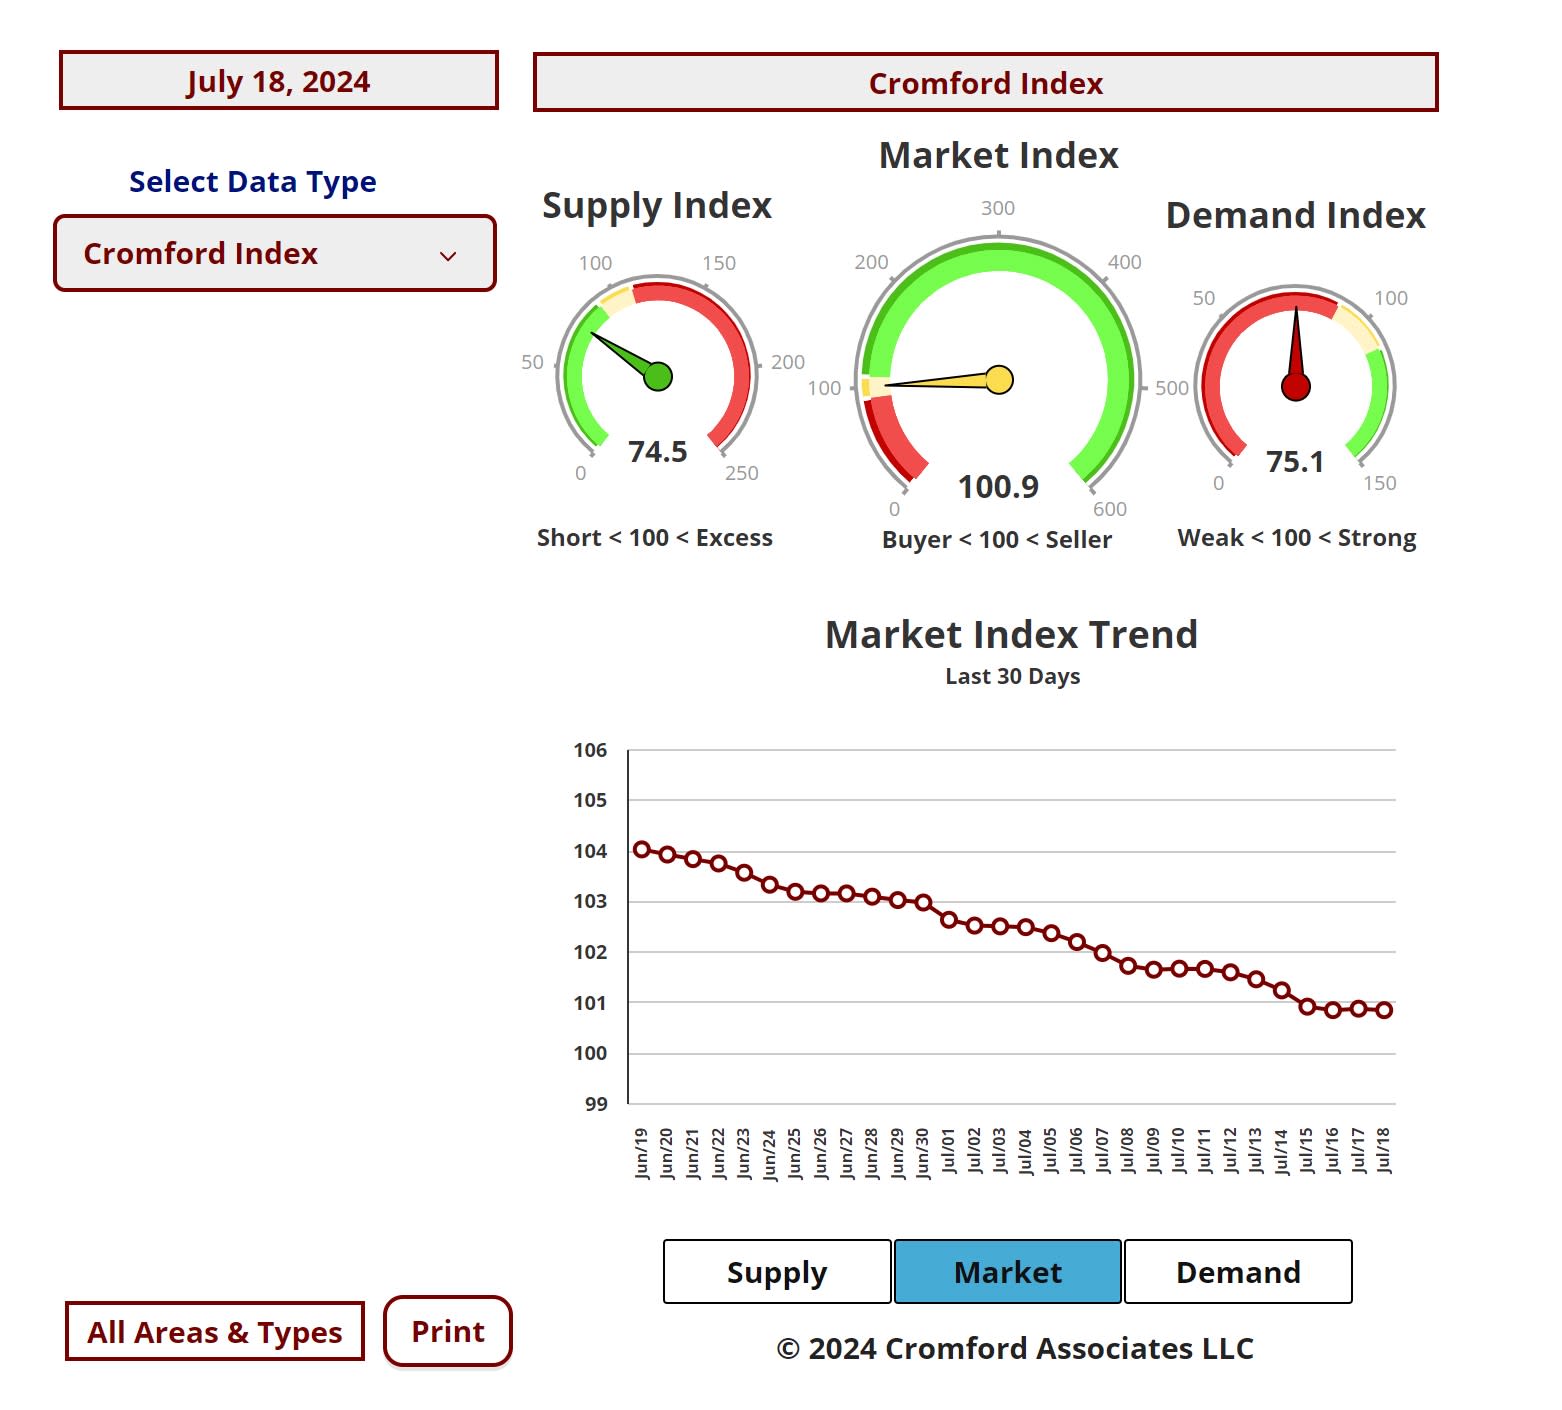
If there is no change in these trends then we can expect the Cromford® Market Index to fall below 100 for the first
time since January 2, 2023.
Closed Listing Commentary
Jul 17 - A pretty reliable indicator of the health of the market is the percentage of list achieved by closed listings.
This can be measured every day for the past month, quarter or year and if the number is falling then the market is
weakening, or vice versa. If the market turns around to the upside, then the monthly percentage will start to
exceed the annual percentage. Although it is reliable, it is substantially slower to react to changes in the market
than other indicators like the contract ratio or the Cromford® Market Index.
Today we see the average for all areas and types standing at 97.64%. That tells us little on its own, but can be
extremely meaningful when compared with numbers from the past.
The long-term average is 97.38% (2001-2024). This suggests that the market is slightly stronger than average,
but not by very much. Last month was 97.81%, so we are in a short-term falling trend.
One year ago, the monthly percentage was 98.06%, so noticeably stronger than the present value. However, the
present value is still above the long term average and not a cause for alarm. The market is softening but it is
doing it very slowly. There is nothing here to support the idea that a crash is happening or imminent.
The highest we have ever measured is 101.94%. This occurred on April 20, 2022. This was when iBuyers and
institutional investors were towards the very end of their massive acquisition spree. Interestingly, we did not get
so high during the height of the housing bubble. The top reading for that period was only 99.55%. This is because
the crash was not caused as much by overpaying but more by over-borrowing. Massive debts were taken on that
had no hope of ever getting repaid and those debts were assigned triple A ratings by debt rating agencies. That
was unusual and is unlikely to happen again during our lifetimes.
The lowest percentage recorded is 93.82%, which was on May 2, 2009.
A reading below 97% is a red flag and this occurred on 5 September 5, 2006. Much later than some signals but
well before prices started to fall dramatically. In recent times, this falling below 97% occurred on December 1,
2022, but it quickly recovered from below 97% by February 25, 2023, and has stayed above 97% ever since.