
Market Statistics Report for July 27, 2024
Market Dashboard – Dashboard
All the statistics shown are for the entire Arizona Regional area as defined by ARMLS. All residential resale transactions
recorded by ARMLS are included. Geographically, this includes Maricopa County, a large part of Pinal county and a small
part of Yavapai county. In addition, "out of area" listings recorded on ARMLS are included, although these usually
constitute a very small percentage of total sales and have very little effect on the data.
All dwelling types are included. For-sale-by-owner, auctions and other non-MLS transactions are not included. Land,
commercial units, and multiple dwelling units are also excluded.
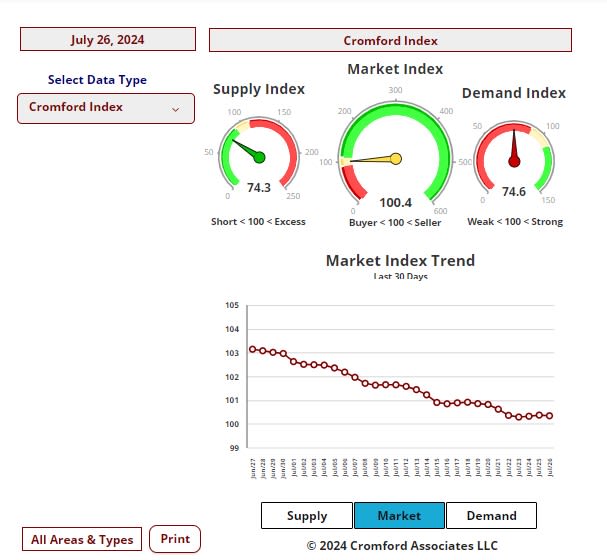
Daily Market Snapshot
area. The figures shown are for the entire Arizona Regional area as defined by ARMLS. All residential resale transactions
recorded by ARMLS are included. Geographically, this includes Maricopa county, the majority of Pinal county and a small
part of Yavapai county. In addition, "out of area" listings recorded in ARMLS are included, although these constitute a very
small percentage (typically less than 1%) of total sales and have very little effect on the statistics.
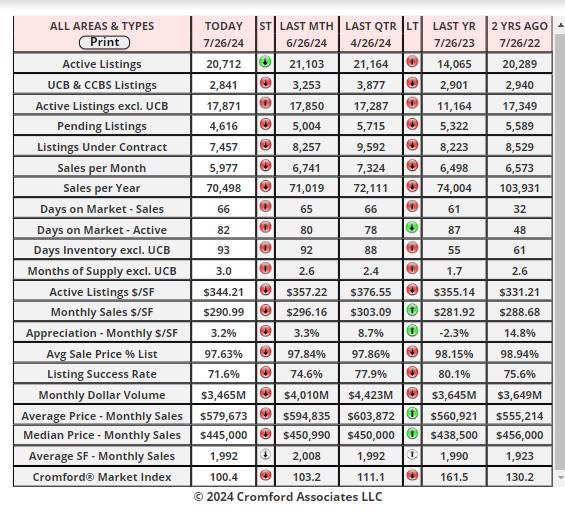
Cromford Market Index
cities.
Cromford Market Index Commentary
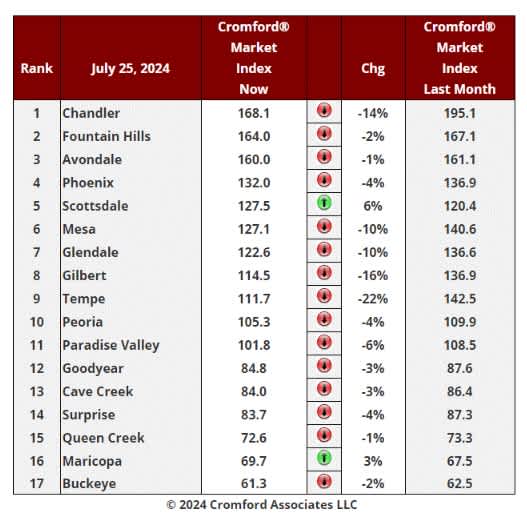
At first sight this looks bad. We have only 2 cities showing an increase in their Cromford® Market Index over the
past month, half as many as last week. Avondale and Queen Creek have reversed course leaving Scottsdale and
Maricopa alone. 15 have declined, so the vast majority have deteriorated for sellers. However, most of these only
fell by a small percentage. Former high-fliers Tempe, Gilbert and Chandler show the biggest falls.
After a second look, things look a lot better. The average change in CMI over the past month is -5.4%, a smaller
fall than the -6.7% we saw last week. The rate of decline has definitely changed direction, and this is a positive sign
for the market. Things are deteriorating more slowly.
9 out of 17 cities remain seller's markets over 110, though that looks unlikely to last much longer for Tempe and
Gilbert. We have 2 cities that are balanced, while the remaining 6 are buyer's markets. 3 cities still remain over
140.
One of the largest markets by dollar volume (Scottsdale) has improved by 6% over the last month. Given that we
are in the middle of the slowest season for luxury homes, this is another encouraging sign for that market.
Cromford Market Index – Sale Price / Sq Ft
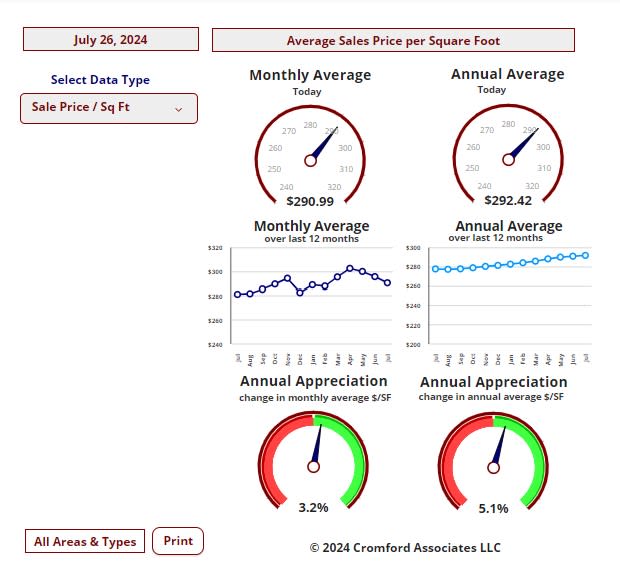
Average Price Per Square Foot
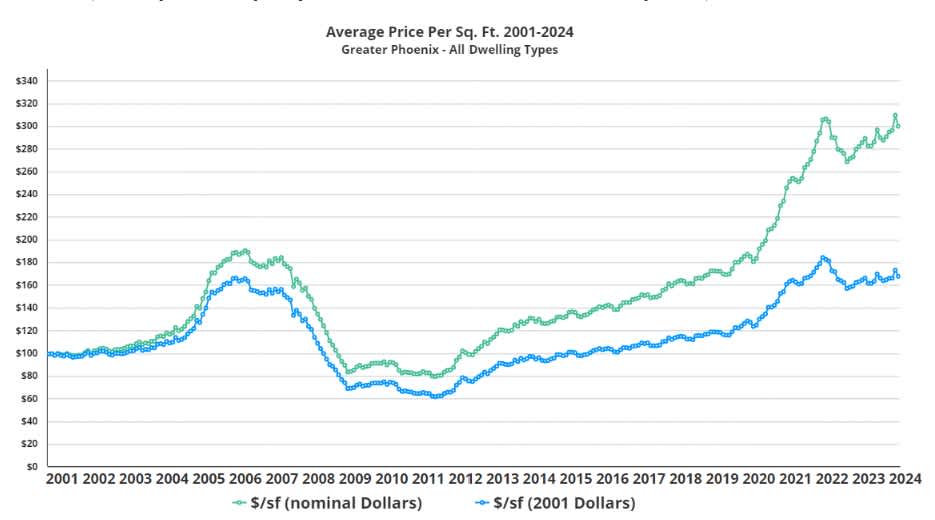
Jul 22 - Throughout this site we tend to use nominal dollars when expressing sale prices. Most people do the same.
Yet this can be a little misleading if we are thinking about how expensive homes are today compared with 24 years
ago.
The average $/SF for January 2001 was $99.04 across Greater Phoenix for all dwelling types. In June 2024 the
same measure was $299.44. On the face of it, prices have increased by 202% and are now over 3 times what they
were at the start of 2001. However, this is not a very fair comparison, since the dollar of 2001 would buy you a lot
more stuff than it does today. It was worth 79% more than the dollar in June 2024, based on the Consumer Price
Index.
The chart above compares the average $/SF over time - in green using the nominal dollars we are all familiar with.
The blue line shows the same average $/SF but expressed in 2001 dollars. We used the Consumer Price Index to
make the adjustment for each month between 2001 and 2024.
We can see that homes are certainly more expensive (on a price per square foot basis) than in 2001 - but only up
by 69% in "real terms", not 202% as suggested by the nominal dollar amounts.
We can also draw some other interesting conclusions:
1. Home prices in real terms were below Jan 2001 levels throughout the period Sep 2008 to Apr 2015. That
was 7 years in which you could pick up a bargain.
2. Home prices in real terms are still significantly lower today than at the peak of May 2022.
3. Home prices in real terms are similar to those at the late stages of the bubble in the first half of 2006.
4. Home prices in real terms are similar to those at the end of 2021.
5. The 2 big boom periods were quite short in duration - mid 2004 to mid-2005 and mid-2020 to mid-2022.
6. The 1 big bust period was also quite short - from early 2007 to early 2009.
The two booms were quite different in nature, since the first was followed by a long period (2006 to 2011) with a
huge excess of inventory for sale, the second was followed by a period in which inventory remained below normal.
This is why we have had two booms and only one bust.