
Market Statistics Report for July 3, 2024
Market Dashboard – Dashboard
All the statistics shown are for the entire Arizona Regional area as defined by ARMLS. All residential resale transactions
recorded by ARMLS are included. Geographically, this includes Maricopa County, a large part of Pinal county and a small
part of Yavapai county. In addition, "out of area" listings recorded on ARMLS are included, although these usually
constitute a very small percentage of total sales and have very little effect on the data.
All dwelling types are included. For-sale-by-owner, auctions and other non-MLS transactions are not included. Land,
commercial units, and multiple dwelling units are also excluded.
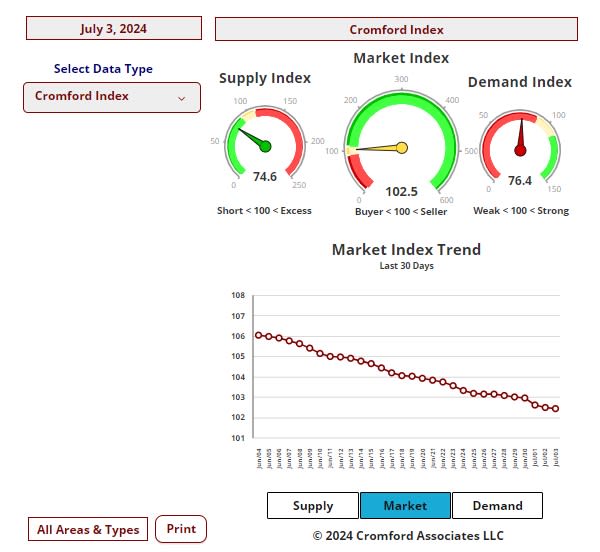
Daily Market Snapshot – City Ranking Snapshot
area. The figures shown are for the entire Arizona Regional area as defined by ARMLS. All residential resale transactions
recorded by ARMLS are included. Geographically, this includes Maricopa county, the majority of Pinal county and a small
part of Yavapai county. In addition, "out of area" listings recorded in ARMLS are included, although these constitute a very small percentage (typically less than 1%) of total sales and have very little effect on the statistics.
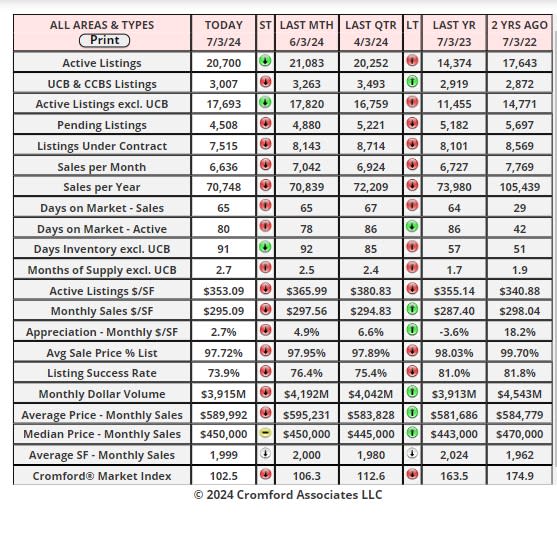
Cromford Market Index
cities.
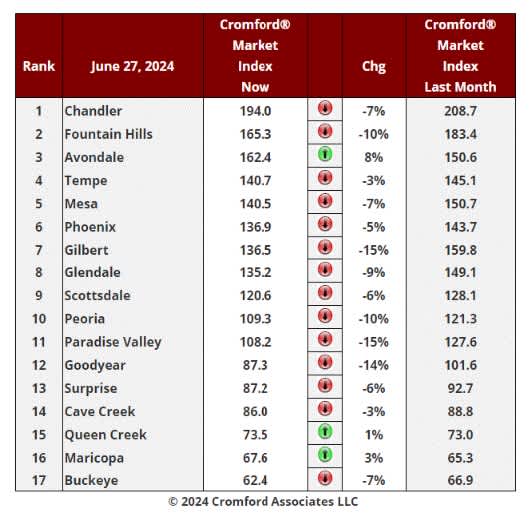
Cromford Market Index Commentary
increasing the downward trend that started 6 weeks ago. As sellers compete with each other, price reductions are
still increasing in both size and frequency.
14 have declined.
favor of buyers: Paradise Valley, Gilbert, Goodyear, Peoria and Fountain Hills.
9 out of 17 cities remain seller's markets over 110. We have 2 cities that are balanced, while the remaining 6 are
buyer's markets.
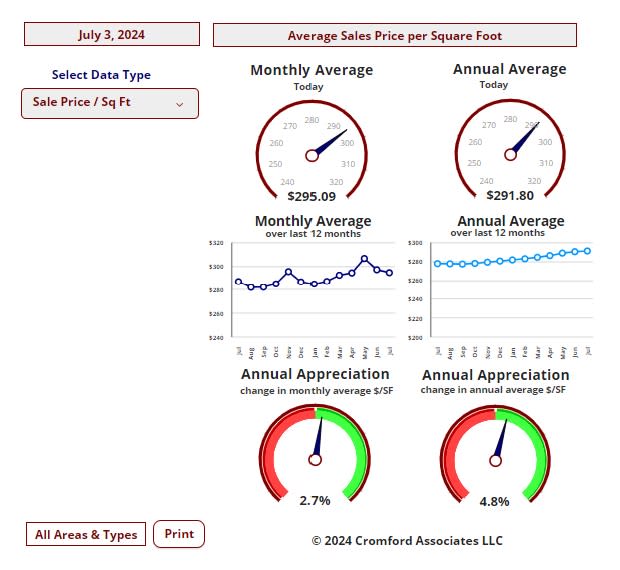
Cromford Market Index – Sale Price / Sq Ft
ARMLS Listing Commentary
Jul 1 - The number of single-family detached homes available for sale in active ARMLS listings has increased by
57% in Greater Phoenix since this time last year. This additional supply in the face of chronically depressed demand
has given rise to a weaker market which is currently very close to balance. Despite this, some segments are still
seller's markets while other strongly favor buyers.
There are some price ranges which have seen larger increases in supply. These are:
• Below $300K - up by 94%
• From $300K and $350K - up by 64%
• From $400K to $450K - up by 76%
• From $500K to $600K - up by 77%
• From $1.5M to $2M - up by 64%
• From $5M to $7.5M - up by 59%
The lowest increases have been in the following price ranges:
• From $700K to $800K - up by 31%
• From $2M to $3M - up by 28%
• From $7.5M to $10M - up by 35%