
Market Statistics Report for June 14, 2024
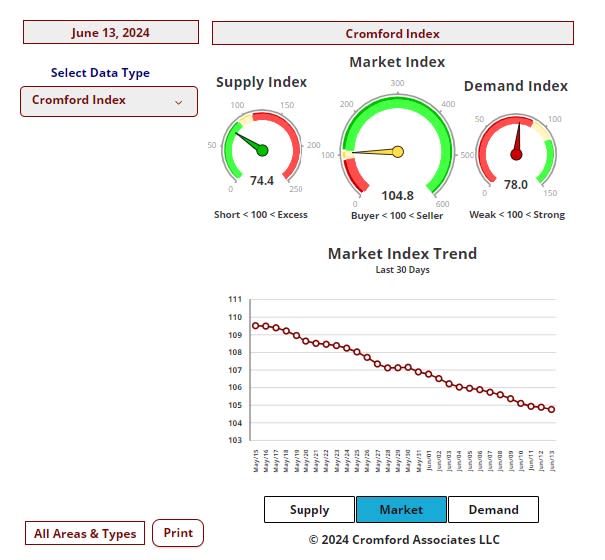
Market Dashboard – Cromford Index - Inventory
This Dashboard provides a comprehensive summary of the current state of the overall residential resale market.
All the statistics shown are for the entire Arizona Regional area as defined by ARMLS. All residential resale transactions
recorded by ARMLS are included. Geographically, this includes Maricopa County, a large part of Pinal county and a small
part of Yavapai county. In addition, "out of area" listings recorded on ARMLS are included, although these usually
constitute a very small percentage of total sales and have very little effect on the data.
All dwelling types are included. For-sale-by-owner, auctions and other non-MLS transactions are not included. Land,
commercial units, and multiple dwelling units are also excluded.
Daily Market Snapshot – City Ranking Snapshot
The table below provides a concise statistical summary of today's residential resale market in the Phoenix metropolitan
area. The figures shown are for the entire Arizona Regional area as defined by ARMLS. All residential resale transactions
recorded by ARMLS are included. Geographically, this includes Maricopa county, the majority of Pinal county and a small
part of Yavapai county. In addition, "out of area" listings recorded in ARMLS are included, although these constitute a very
small percentage (typically less than 1%) of total sales and have very little effect on the statistics.
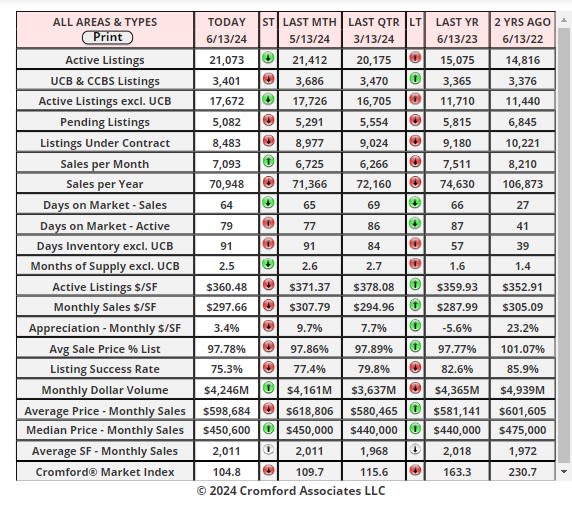
Cromford Market Index
June 13- Here is our latest table of Cromford® Market Index values for the single-family markets in the 17 largest
cities.
Cromford Market Index Commentary
The average change in CMI over the past month is -3.4%, a steeper fall than the -2.1% we saw last week. This is
continuing the downward trend that started 4 weeks ago. Price reductions are again increasing in both size and
frequency.
In contrast to last week, we only have 4 cities showing an increase in their Cromford® Market Index over the past
month, while 13 have declined.
Cave Creek is the biggest mover in favor of sellers, but it is only up 8% over last month. Glendale, Peoria, Mesa,
Phoenix and Gilbert are the primary locations moving in favor of buyers, with Gilbert's market deteriorating the
fastest.
Despite the continuing deterioration, 11 out of 17 cities remain seller's markets. We have 2 cities (Goodyear and
Cave Creek) that are balanced, while the remaining 4 are buyer's markets.
Listings Under Contract
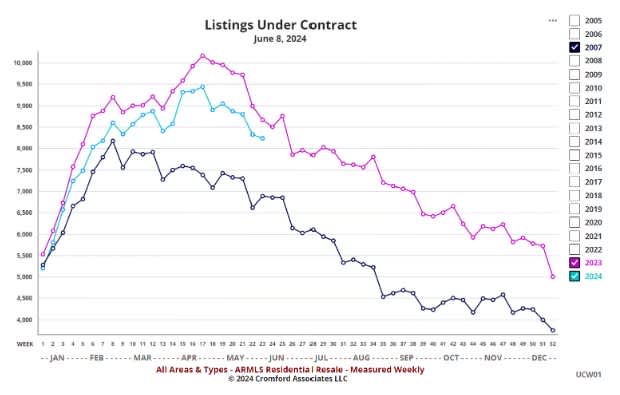
Jun 14 - The number of listings under contract (8,238) at week 23 is the lowest we have recorded for that time of
the year since 2007.
At no point so far in 2024 has the count managed to claw its way above the miserable totals for 2023.
Now 2007 was an awful year with the market stalled by the certain knowledge that house prices were about to
collapse. We are not in that situation in 2024, but buyer enthusiasm for re-sale homes is still very low indeed. To
put 8,238 into perspective, the total for week 23 of 2011 was well over 21,000.
If the 30-year fixed mortgage rate finally tumbles well below 7% then things are likely to improve. I recommend
watching the turquoise line above to see if it can creep above the purple line over the next couple of months.
The interactive version of this chart is here.
Luxury Market Commentary
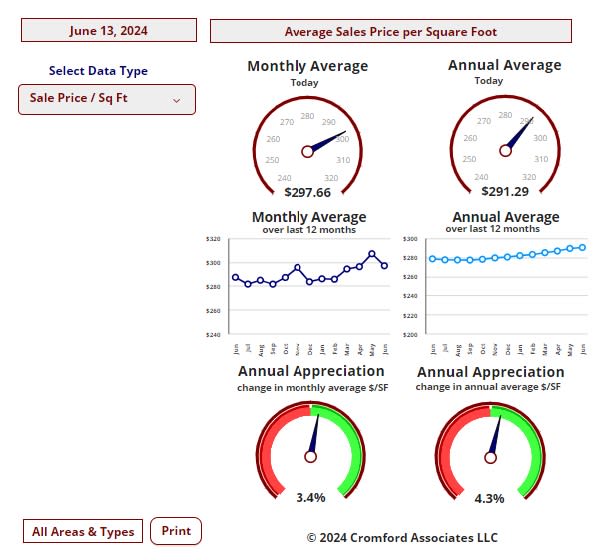
Jun 10 - The median sales price is very little affected by the luxury market because luxury homes sell in relatively
small numbers. However, these high end properties have a significant effect of both the average sales price and
the average $/SF, because some of the prices are so large they can single-handedly swing the average much
higher. The median tends to ignore all of the extremes at the top and bottom. This is why it is so popular with
analysts who are dealing with real estate numbers that tend to have questionable quality.
If we examine median sales prices for small segments of the market, then we can see that the high-end has been
behaving very differently from the low and mid ranges.
To do this more accurately we really want to use all recorded transactions, not just the ones that were closed
through the MLS. So we turn to the Cromford® Public chart EM11 and use the various filters to find that:
• The overall median sales price has been in a rising trend since February 2023 but has still not overtaken the peak
of $470,000 achieved in both May and June of 2022. It stood at $456,995 as of April 2024.
• If we restrict our study to the Northeast Valley (Scottsdale, PV, Fountain Hills, Cave Creek and Carefree), then
the median is strong and hit a new record high of $879,500 in April 2024. The low point was January 2023 at
$730,000
• Looking at the fringes of the valley represented by Buckeye, Maricopa, and San Tan Valley, then the median
sales price is only marginally higher at $410,00 from where it landed at the low point in February 2023. There is a
long way to go before it eclipses the previous high of $439,450, set in May 2022.
Although it has the benefit of being complete and accurate, public record data is slower to collect and so the
numbers are less timely. This is why we refer to April numbers rather than May.
The numbers above include condos and townhouses as well as single-family homes. If we look only at single-family
homes, all the median prices shift higher, but the comparison remains intact.