
Market Statistics Report for June 5, 2024
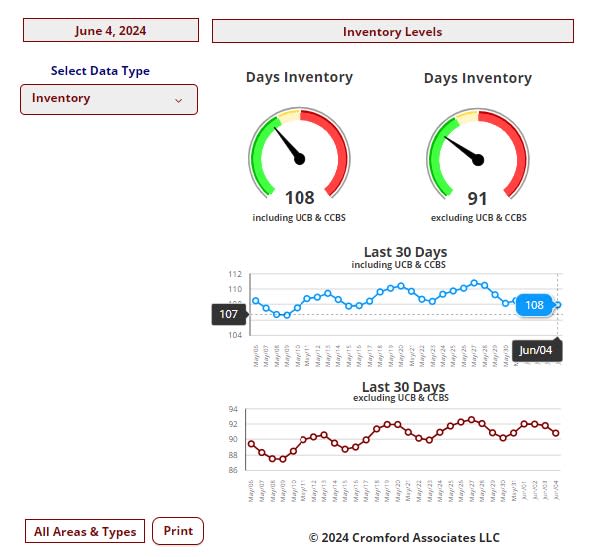
Market Dashboard – Cromford Index - Inventory
All the statistics shown are for the entire Arizona Regional area as defined by ARMLS. All residential resale transactions
recorded by ARMLS are included. Geographically, this includes Maricopa County, a large part of Pinal county and a small
part of Yavapai county. In addition, "out of area" listings recorded on ARMLS are included, although these usually
constitute a very small percentage of total sales and have very little effect on the data.
All dwelling types are included. For-sale-by-owner, auctions and other non-MLS transactions are not included. Land,
commercial units, and multiple dwelling units are also excluded.
Daily Market Snapshot – City Ranking Snapshot
area. The figures shown are for the entire Arizona Regional area as defined by ARMLS. All residential resale transactions
recorded by ARMLS are included. Geographically, this includes Maricopa county, the majority of Pinal county and a small
part of Yavapai county. In addition, "out of area" listings recorded in ARMLS are included, although these constitute a very small percentage (typically less than 1%) of total sales and have very little effect on the statistics.
Cromford Market Index
cities.
Cromford Market Index Commentary
The average change in CMI over the past month is -0.8%, down from +0.1% last week and continuing the downward
trend that started 2 weeks ago. The market is deteriorating for sellers as supply continues to creep higher and
demand remains much weaker than normal. We expect more impatient sellers to increase the size and frequency
of price reductions.
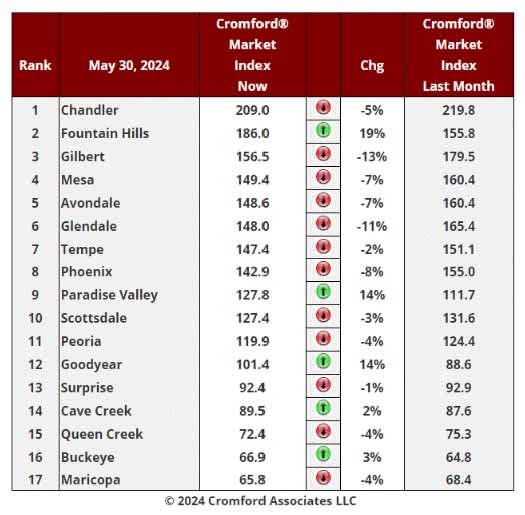
We have only 5 cities showing an increase in their Cromford® Market Index over the past month, while 12 have
declined. This is the same as last week.
Paradise Valley, Fountain Hills and Goodyear are by far the biggest movers in favor of sellers. Glendale and Gilbert
are the primary locations moving in favor of buyers.
Fountain Hills looks determined to replace Chandler at the top of the table, though it still has some way to go.
Despite the deterioration, 11 out of 17 cities are seller's markets. We have 2 cities (Goodyear and Surprise) that
are balanced, while the remaining 4 are buyer's markets.
Market Summary for the Beginning of June
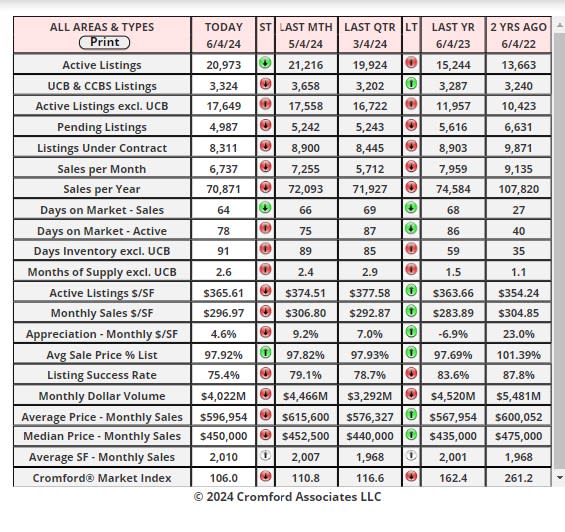
Here are the basics - the ARMLS numbers for June 1, 2024, compared with June 1, 2023 for all areas & types:
• Active Listings (excluding UCB & CCBS): 17,129 versus 11,730 last year - up 54% - and up 5.3% from 17,129 last month
• Active Listings (including UCB & CCBS): 21,353 versus 15,062 last year - up 42% - and up 1.8% compared with 20,979 last
month
• Pending Listings: 5,015 versus 5,696 last year - down 12% - and down 8.6% from 5,486 last month
• Under Contract Listings (including Pending, CCBS & UCB): 8,324 versus 9,028 last year - down 7.8% - and down 11% from
9,336 last month
• Monthly Sales: 7,508 versus 8,107 last year - down 7.4% - but up 6.6% from 7,046 last month
• Monthly Average Sales Price per Sq. Ft.: $297.71 versus $287.67 last year - up 3.5% - but down 2.9% from $306.61 last month
• Monthly Median Sales Price: $450,000 versus $425,000 last year - up 5.9% - and unchanged from $450,000 last month
We are now seeing a weakening trend in the market. The Cromford® Market Index stands at 106 but is dropping. Sellers are nervous and
buyers are unenthusiastic. We are not in a buyer's market overall, but some significant markets are. If current trends continue then more
areas could join them.
Supply continues to climb, which is unusual for the time of year and we notice that the rate of climb has increased since last month. Buyers
have 54% more homes to choose from than they had last year but still face 30-year mortgage rates over 7% which is limiting demand.
Sellers are starting to face serious competition from each other and their agents are having to work hard to get their homes sold.
Most of the slightly positive signs we saw last month have disappeared. We have far fewer pending listings than last month and under
contract listings are down 7.8% from this time last year. The closed sales count for May was higher than April but down 7.4% compared
with last year.
Pricing was unexpectedly strong in April, but May has seen this trend reverse and the average price per sq. ft. is now up only 3.5% for the
last year. The median sale price was unchanged, as it is far less affected by the luxury home market. It is up just under 6% compared to
a year ago.
We are entering the weakest time of the year, between June and September when luxury home buyers are thin on the ground. They tend
to find cooler places to hang out than face the heat of a Phoenix summer house hunting expedition. Investors are busy during the summer
as bargains are easier to find and gross margins on fix-and-flips are looking very healthy these days. Investors tend to pay less than
market value, so this also drives the average $/SF lower between June and September. We expect pricing to be flat to lower over the next
3 months, after a strong rise between January and May.
The new home market remains healthier than the re-sale market and this creates extra competition for sellers in areas and price ranges
where home builders are active.
Commentary on Current Inventory
Jun 1 - The re-sale market is cooling as supply continues to climb while demand remains subdued. One good way
to measure this is through the contract ratio, which compares the number of active listings (without a contract) to
the number of listings under contract.
For all areas & types, the contract ratio has dropped 15% from 54.5 to 46.1 over the last month. This compares
poorly with 77.0 on June 1 last year. The current 46.1 reading represents a balanced market with buyers finding
plenty of supply to choose from and sellers experiencing more competition from each other than they have for most
of the last decade. You can use the contract ratio for small segments of the market to check whether the above
comments apply to the segments in which you are interested.
Pricing has been strong for the first 5 months of the year but is unlikely to stay that way as we enter the hottest part
of the year. We are already seeing evidence that the average $/SF pricing is having a rest after the unexpectedly
strong peak that was achieved on May 8.