
Market Statistics Report for March 13, 2024
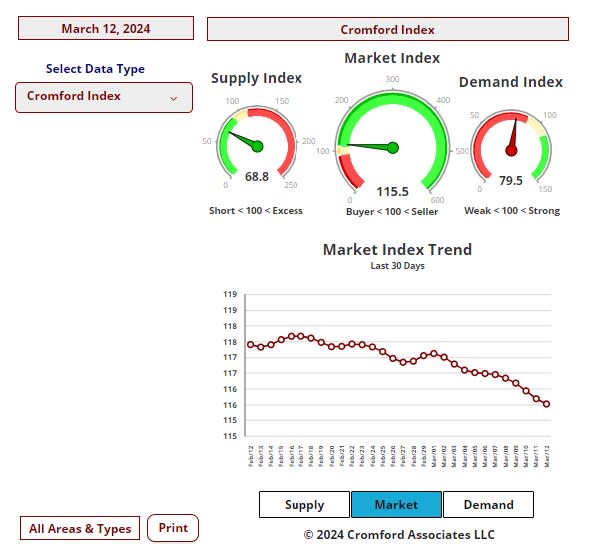
Market Dashboard – Cromford Index
All the statistics shown are for the entire Arizona Regional area as defined by ARMLS. All residential resale transactions
recorded by ARMLS are included. Geographically, this includes Maricopa county, a large part of Pinal county and a small
part of Yavapai county. In addition, "out of area" listings recorded on ARMLS are included, although these usually
constitute a very small percentage of total sales and have very little effect on the data.
All dwelling types are included. For-sale-by-owner, auctions and other non-MLS transactions are not included. Land,
commercial units, and multiple dwelling units are also excluded.
Daily Market Snapshot – City Ranking
area. The figures shown are for the entire Arizona Regional area as defined by ARMLS. All residential resale transactions
recorded by ARMLS are included. Geographically, this includes Maricopa county, the majority of Pinal county and a small
part of Yavapai county. In addition, "out of area" listings recorded in ARMLS are included, although these constitute a very
small percentage (typically less than 1%) of total sales and have very little effect on the statistics.
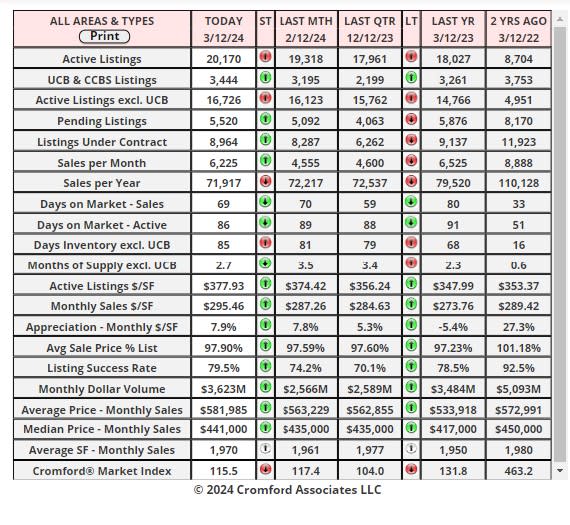
Cromford Market Index
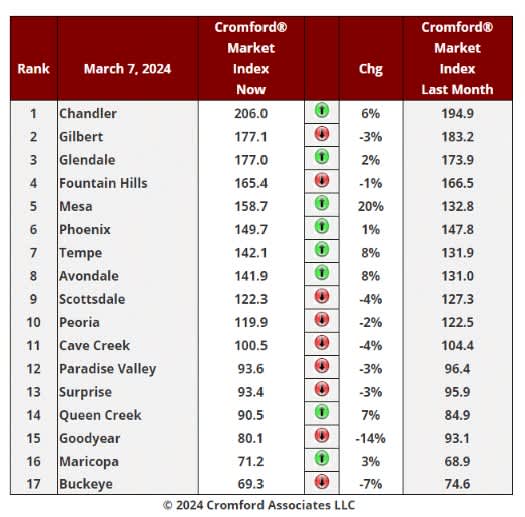
This is the first table with a majority of red markers since December 21.
from 1.6% last week. Mesa is single-handedly responsible for the positive average of 0.85, because without mesa
the average would be -0.3%. Tempe, Avondale, Chandler and Queen Creek are the only other cities with a
substantial move higher over the past month.
the foot of the table.
Creek has moved back into the balanced range of 90-110.
Demand is still rising, although very slowly. Supply is also still rising, but at a slightly faster pace. This means there
is now a small amount of momentum towards a more neutral market. This does not apply as much to the Southeast
Valley which is still significantly favorable to sellers. Glendale, Avondale and Phoenix are also in the control of
sellers.
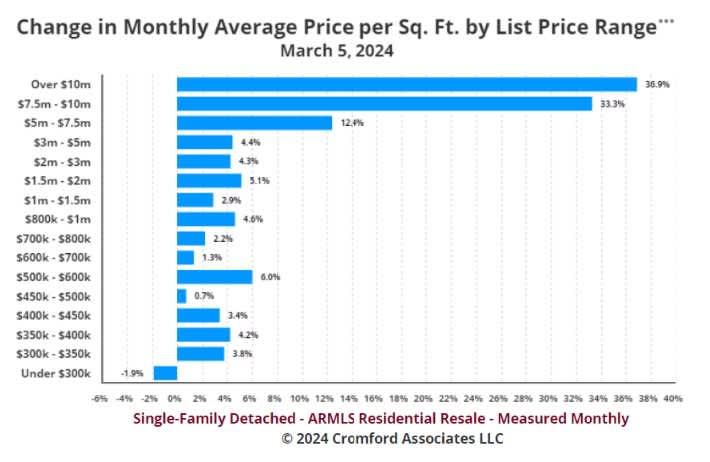
Change in Monthly Average Price per Sq Ft by List Price Range
quite looked like this before.
Something very unusual is happening in the ultra-luxury home market. The average price per sq. ft. for
homes priced at $7.5 million or more has increased by over 33% over the last 12 months. This is based
on the recorded selling prices, not the asking prices. It compares February 2023 with February 2024.
Admittedly the sample size is not huge. Only a handful of homes over $7.5 million are closed each
month. But if we look at a similar chart based on a whole year of sales we get the following:
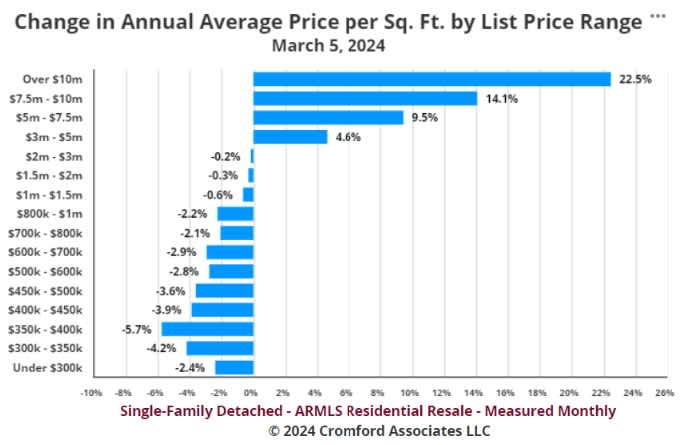
This is pretty convincing evidence that buyers of ultra-luxury homes have been willing to follow the
market much higher, while homes under $2 million have not seen the same exuberance.
I am not sure how to explain this, but clearly buyers of these homes are not constrained by affordability
issues that affect the rest of the market.