
Market Statistics Report for March 7, 2024
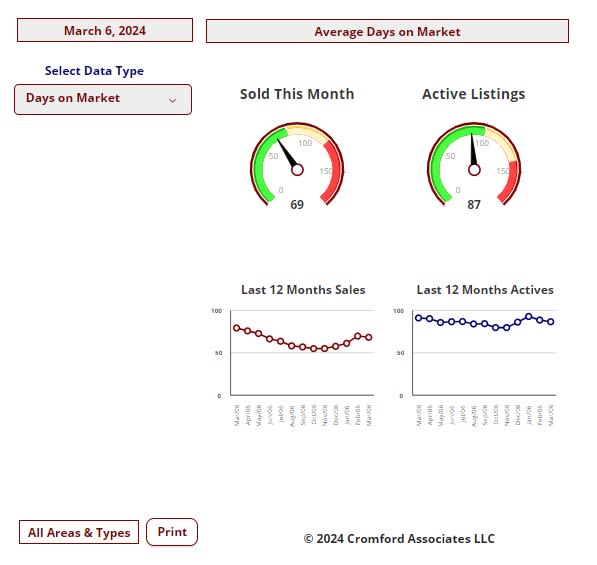
Market Dashboard – Days on Market
This Dashboard provides a comprehensive summary of the current state of the overall residential resale market.
All the statistics shown are for the entire Arizona Regional area as defined by ARMLS. All residential resale transactions
recorded by ARMLS are included. Geographically, this includes Maricopa county, a large part of Pinal county and a small
part of Yavapai county. In addition, "out of area" listings recorded on ARMLS are included, although these usually
constitute a very small percentage of total sales and have very little effect on the data.
All dwelling types are included. For-sale-by-owner, auctions and other non-MLS transactions are not included. Land,
commercial units, and multiple dwelling units are also excluded.
Daily Market Snapshot – City Ranking
area. The figures shown are for the entire Arizona Regional area as defined by ARMLS. All residential resale transactions
recorded by ARMLS are included. Geographically, this includes Maricopa county, the majority of Pinal county and a small
part of Yavapai county. In addition, "out of area" listings recorded in ARMLS are included, although these constitute a very
small percentage (typically less than 1%) of total sales and have very little effect on the statistics.
Cromford Market Index
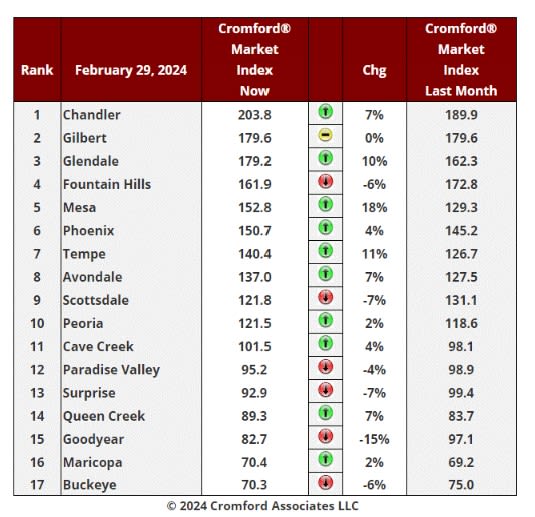
Cromford Market Index Commentary
We have 10 cities showing an increase in their Cromford® Market Index over the past month, while 6 have
deteriorated and 1 is stationary. Scottsdale, Paradise Valley, Fountain Hills, Surprise, Buckeye and especially
Goodyear have once again moved in a direction that is favorable to buyers.
There has been an average monthly increase of 1.6% in the Cromford® Market Index for the 17 cities, down from
the 3.1% we recorded last week. Thanks to the strong performance of Chandler, Mesa, Glendale and Tempe, we
are still reporting a positive change over the month, but the trend is still weakening and on the current path we are
heading towards neutrality.
10 out of 17 cities are still seller's markets. We have 3 cities that are balanced and 4 are buyer's markets. This is
similar to last week, but Maricopa has overtaken Buckeye while Queen Creek has almost achieved a balanced
market.
The overall CMI for the market is stuck near 117 and has fallen slightly over the past 14 days. Demand is still rising
slowly, but so is supply. Both are heading very slowly back towards normality, which is a reading of 100. They have
a long way to go, and at 67.5 the Cromford® Supply Index is still below the Cromford Demand® Index at 78.7, but
it is increasing at a slightly faster rate. This means buyers are very slightly improving their bargaining power. This
power is strong in the areas with a CMI below 80 and almost non-existent in areas over 150.
More central areas with a lot of mid-range homes continue to be the strongest sub-markets. Upscale areas are
looking weaker than last year, as are the outlying areas, particularly in the West Valley.
Affidavits of Value Commentary
Mar 5 - The affidavits of value have been counted and analyzed for Maricopa County's February filings and her is
what we found:
• There were 5,933 closed transactions, up a tiny fraction from 5,910 in February 2023 and up 25% from January.
• There were 1,345 closed new homes, up 11% from 1,208 in February 2023 and up 23% from January.
• There were 4,588 closed re-sale transactions, down 2.4% from 4,702 in February 2023 but up 25% from January.
• The overall median sales price in February was $467,234, up 6.2% from February 2023 and up 2.7% from
January.
• The re-sale median sales price was $450,000, up 7.1% from February 2023 and up 2.5% from January.
• The new home median sales price was $516,215, up 0.3% from February 2023 and up 3.3% from January.
Closing counts were again weak in February for re-sales, but robust for new homes. Pricing was impressive for resales but less so for new homes, up only 0.3% from a year ago.
New homes took 23% market share. Three years ago, new homes were less than 16% of the total units sold.
These numbers are for single family and townhouse / condo homes.
New Homes Market
In January across Maricopa and Pinal Counties, we saw 1,507 new homes closed. This is up almost 14% from
1,324 in January 2023. In contrast normal MLS re-sales in the same territory numbered 2,950. This is not only
down 5% from January 2023, but also the lowest monthly total in the last 11 years. These numbers include singlefamily, townhouse and condo property types.
January 2024, down over 19% from 299 in January 2023. New home sales are more numerous than re-sales in
Pinal, with 341 in January 2023 growing 21% to 413 in January 2024.
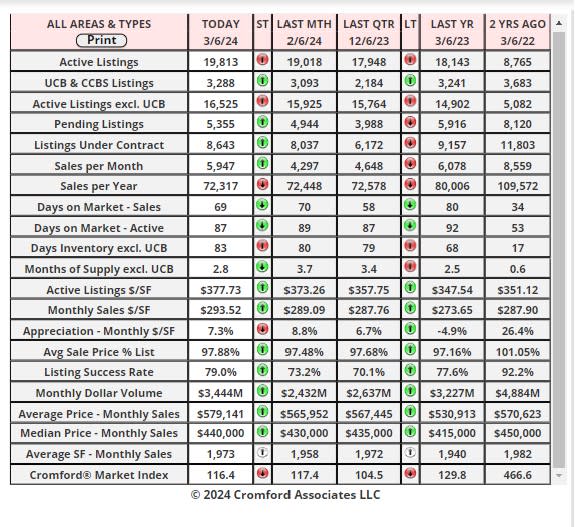
Market Summary for the Beginning of March
Here are the basics - the ARMLS numbers for March 1, 2024 compared with March 1, 2023 for all areas & types:
• Active Listings (excluding UCB & CCBS): 16,568 versus 14,739 last year - up 12% - and up 6.4% from 15,574 last
month.
• Active Listings (including UCB & CCBS): 19,890 versus 17,937 last year - up 11% - and up 8.0% compared with
18,421 last month.
• Pending Listings: 5,371 versus 5,911 last year - down 9.1% - but up 17% from 4,576 last month
• Under Contract Listings (including Pending, CCBS & UCB): 8,693 versus 9,109 last year - down 4.6% - but up 17%
from 7,423 last month.
• Monthly Sales: 5,720 versus 5,706 last year - up 0.2% - and up 29% from 4,435 last month
• Monthly Average Sales Price per Sq. Ft.: $293.70 versus $271.11 last year - up 8.3% - and up 1.7% from $288.74
last month
• Monthly Median Sales Price: $440,000 versus $413,000 last year - up 6.5% - and up 2.3% from $430,000 last month
This set of numbers is a little disappointing, but by no means disastrous. On the bright side, closed listing counts for
February 2024 managed to exceed February 2023, but only by 0.2%. This is not the recovery in volume that so many
are impatiently hoping for. Also brighter, sales pricing performed better than anticipated and was up 1.7% from last
month based on the monthly average sales price per square foot. The monthly median sale price rose by $10,000 too.
However, the rate at which contracts are getting signatures is lower than we expected and much lower than normal. We
are starting March with only 8,693 listings under contract, down 4.6% from this time last year. And last year was well
below normal.
The slow contract signing rate means active listing counts have continued to grow steadily, up by 2,000 since the start
of the year. Last year we saw a fall of over 1,500 over the same period, because new supply was much scarcer then. It
was the decline in supply that allowed us to scoff a year ago when Goldman Sachs published their ludicrous forecast that
Arizona home prices would fall to 2008 levels in 2023. That certainly proved they had no idea what they were talking
about. Prices are now up 8.3% from this time last year. But I suppose we should not be surprised - Goldman Sachs also
had a "conviction buy" rating on Wirecard in 2019, the same company that declared insolvency 9 months later when
their auditors finally spotted that over $2 billion in Wirecard's cash account did not actually exist. But I digress.
There is still no sign of a market crash in the short or medium term, but the market is struggling to gain traction. The
healthy amount of incoming supply is not quite matched by a small improvement in demand and the balance between
sellers and buyers only favors sellers by a small amount when considering the market as a whole. In many sectors of
the market, buyers have more negotiating room, even though, judging by the recent price movements, most of them
do not seem to realize this.
At the top end of the market, we have a lot of supply.
• Over $10 million, there are 76 active listings - this is 2.6 years of supply at the current closing rate of 29 per year.
• Between $5 million and $10 million, there are 221 active listings - this is 16 months of supply at the current closing
rate of 164 per year.
• Between $3 million and $5 million, there are 319 active listings - this is 8 months of supply at the current closing rate
of 455 per year.
In certain outlying areas, we also have plenty of active listings. Examples include Casa Grande, Maricopa and Buckeye.
But many cities that are closer to Phoenix and are dominated by homes under $1 million still have a tight supply and
buyers outnumber sellers in most of these areas.
Market conditions are currently quite stable, so the idea that some sort of collapse is imminent is extremely far-fetched.
However conditions can and often do change with little notice, so it is always worth to keeping a close eye on the key
numbers. At least once a week would be our suggestion. We check them all daily, but we admit we are far from normal.
Not sorry about that.