
Market Statistics Report for May 2, 2024
Market Dashboard – Cromford Index
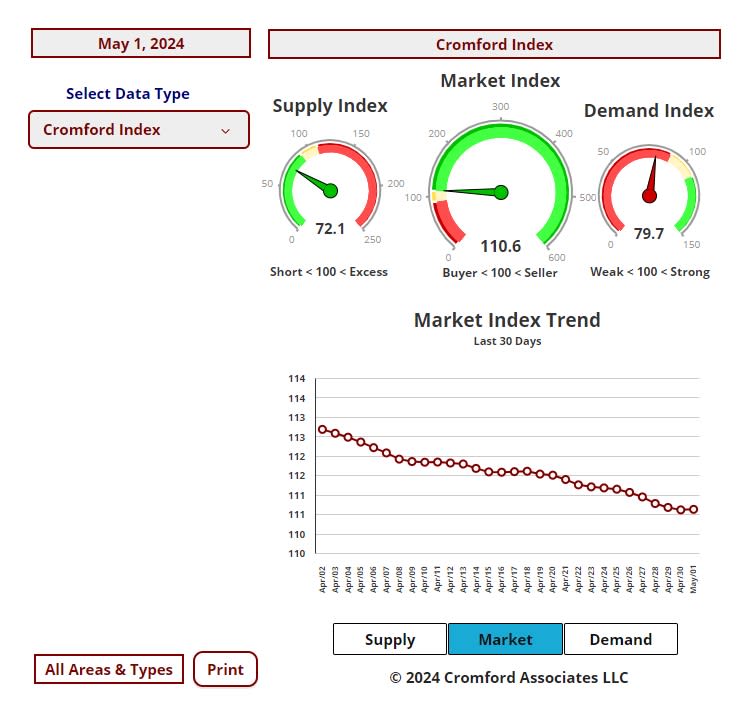
This Dashboard provides a comprehensive summary of the current state of the overall residential resale market.
Daily Market Snapshot – City Ranking
Cromford Market Index
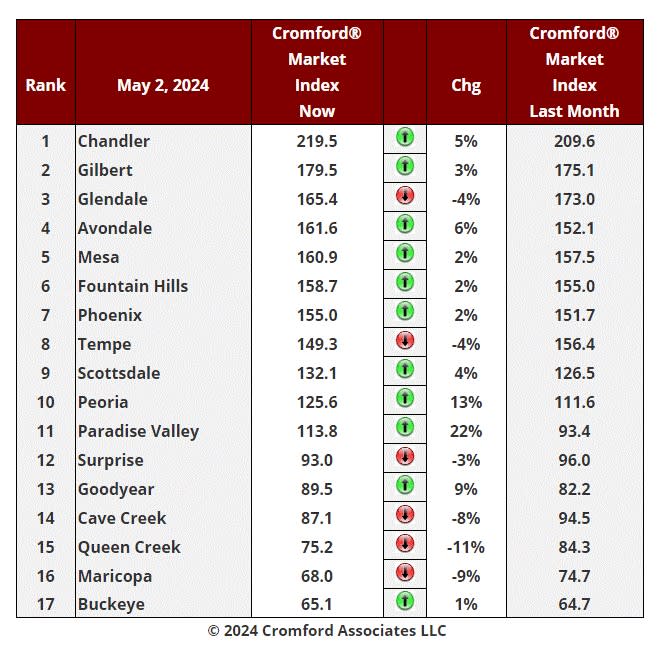
May 2 - Here is our latest table of Cromford® Market Index values for the single-family markets in the 17 largest cities.
Cromford Market Index Commentary
Once again we are seeing small signs of improvement in the market for sellers in certain sub-markets.
The average change in CMI over the past month is +1.7%, up from +1.4% last week and continuing a trend that started four weeks ago.
We have 11 cities showing an increase in their Cromford® Market Index over the past month, while 6 have declined. This is also better than last week.
Paradise Valley, Peoria and Goodyear are the biggest moves in favor of sellers, followed by Avondale and Chandler. Queen Creek, Maricopa and Cave Creek are the primary locations moving in favor of buyers. Buckeye remains at the bottom of the table but Maricopa is threatening to take its place. Chandler is still far out in front at the top. Queen Creek is now well below 80 while Maricopa has joined Buckeye below the 70 level. Buyers have strong negotiating power at these three locations.
11 out of 17 cities are seller's markets now that Paradise Valley has joined the group. We have 1 city (Surprise) that is balanced, while 5 are buyer's markets, although Goodyear looks set to leave that group very shortly.
Price Changes – Dollar Amount
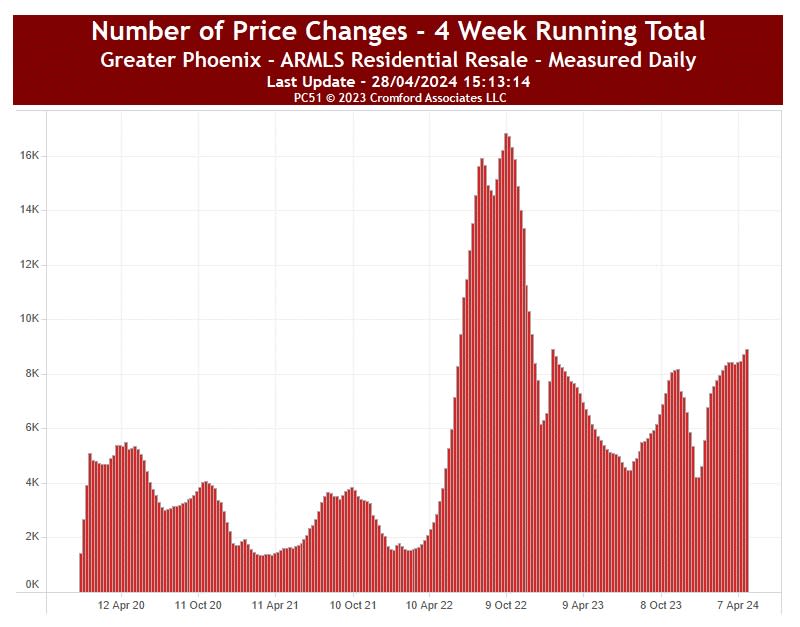
Apr 28 - We are seeing almost 9,000 price cuts over the last 4 weeks, a level we have not seen since January last year.
Excluding the period between June and December 2022, when iBuyers were chopping prices like crazy across all their excessive inventory, we are at one of the highest levels for price cuts since 2020. Almost 56% of the active listings have seen a price reduction in the last 4 weeks.
Although their listings are far less numerous, homes over $3 million are also seeing far more price cuts than usual, as seen in the chart below:
Price Changes – Days On Market
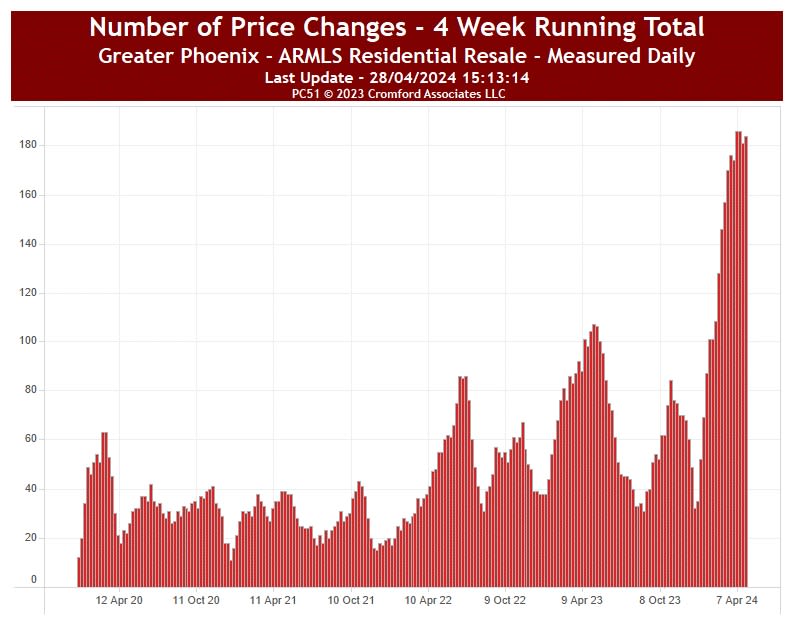
April 28 - They tend to stay on market for a much longer time and their price reductions are usually spread out over many months.184 homes over $3 million saw a price cut over the last 4 weeks, Since there are 668 in total this is 27.5% of the high-end listings getting reduced. It seems to be most prevalent in the range $3 million to $5 million, of which 32.4% have seen a price cut in the last 4 weeks. A smaller percentage of homes over $5 million have been reduced - 22%.