
Market Statistics Report for May 28, 2024
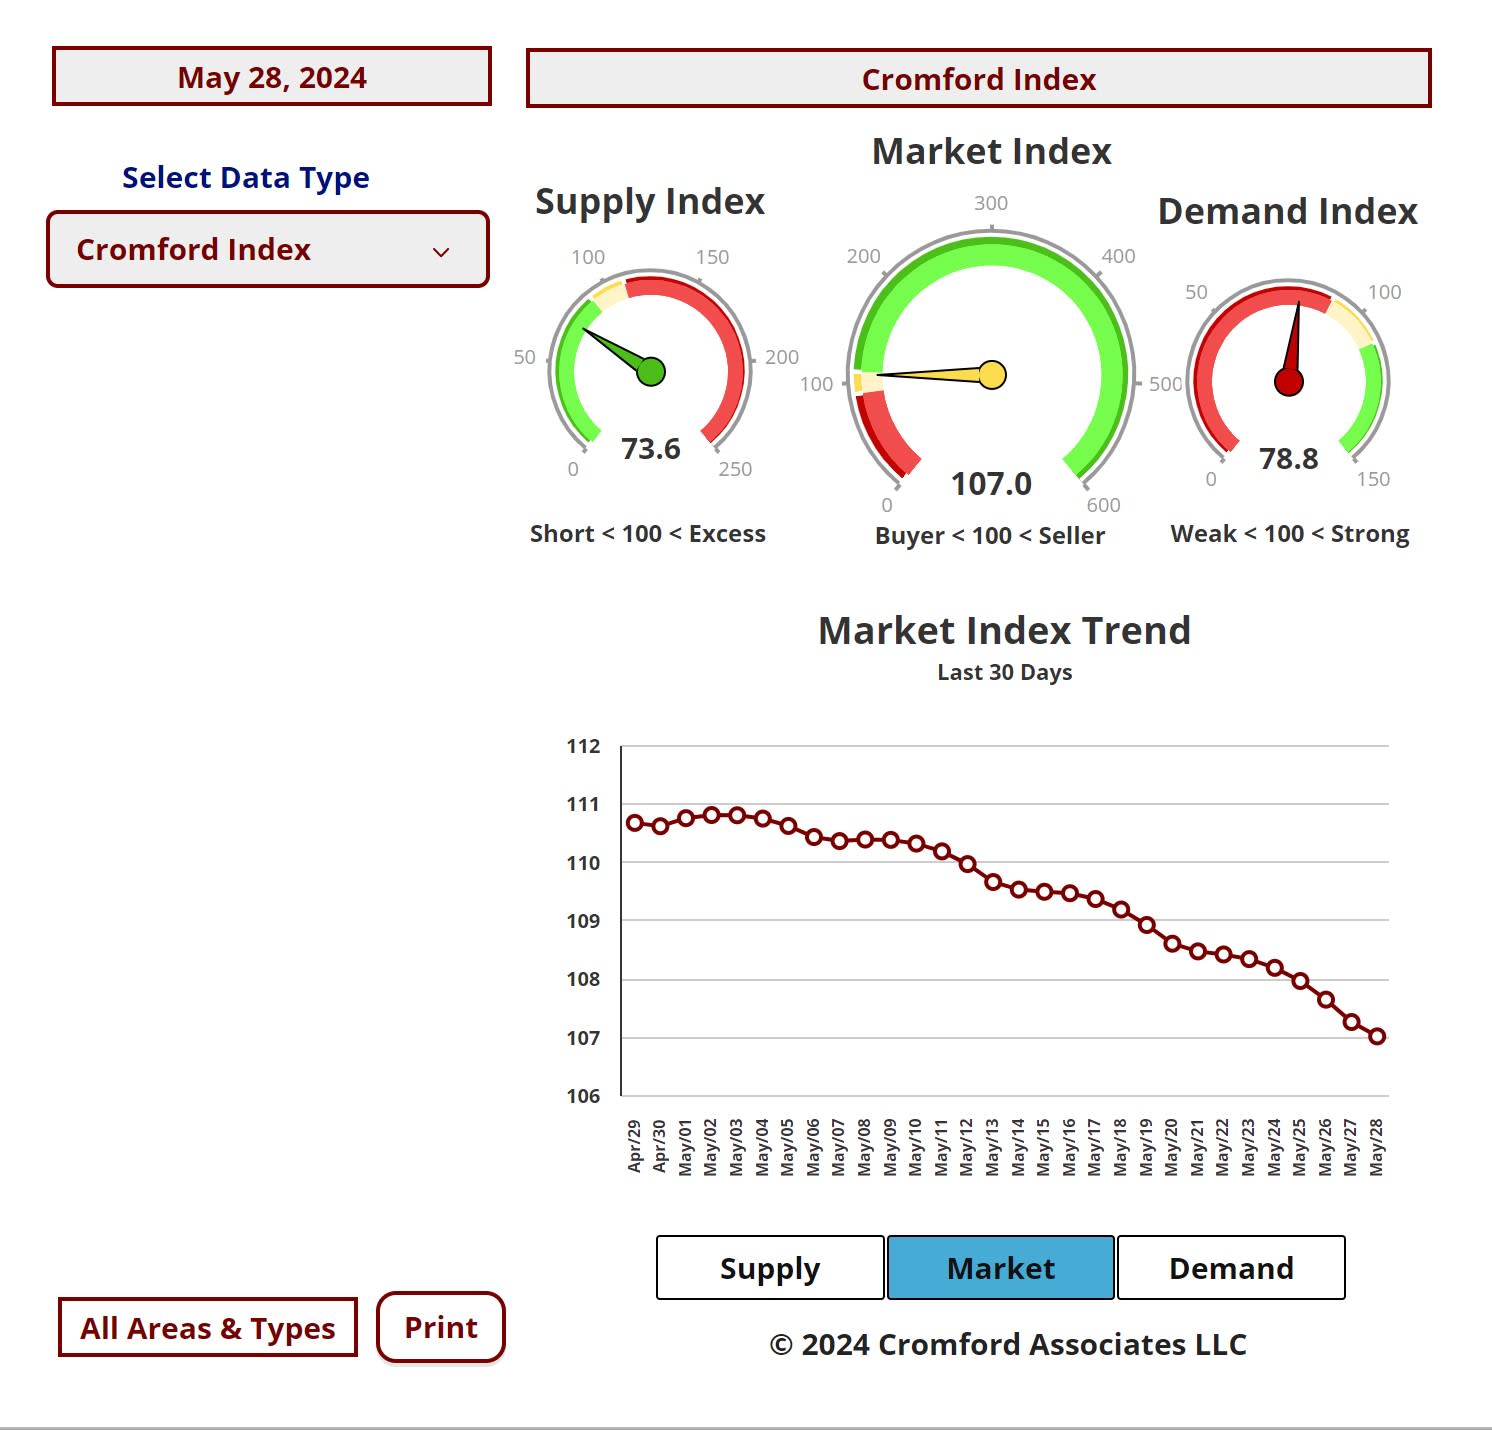
Market Dashboard – Cromford Index
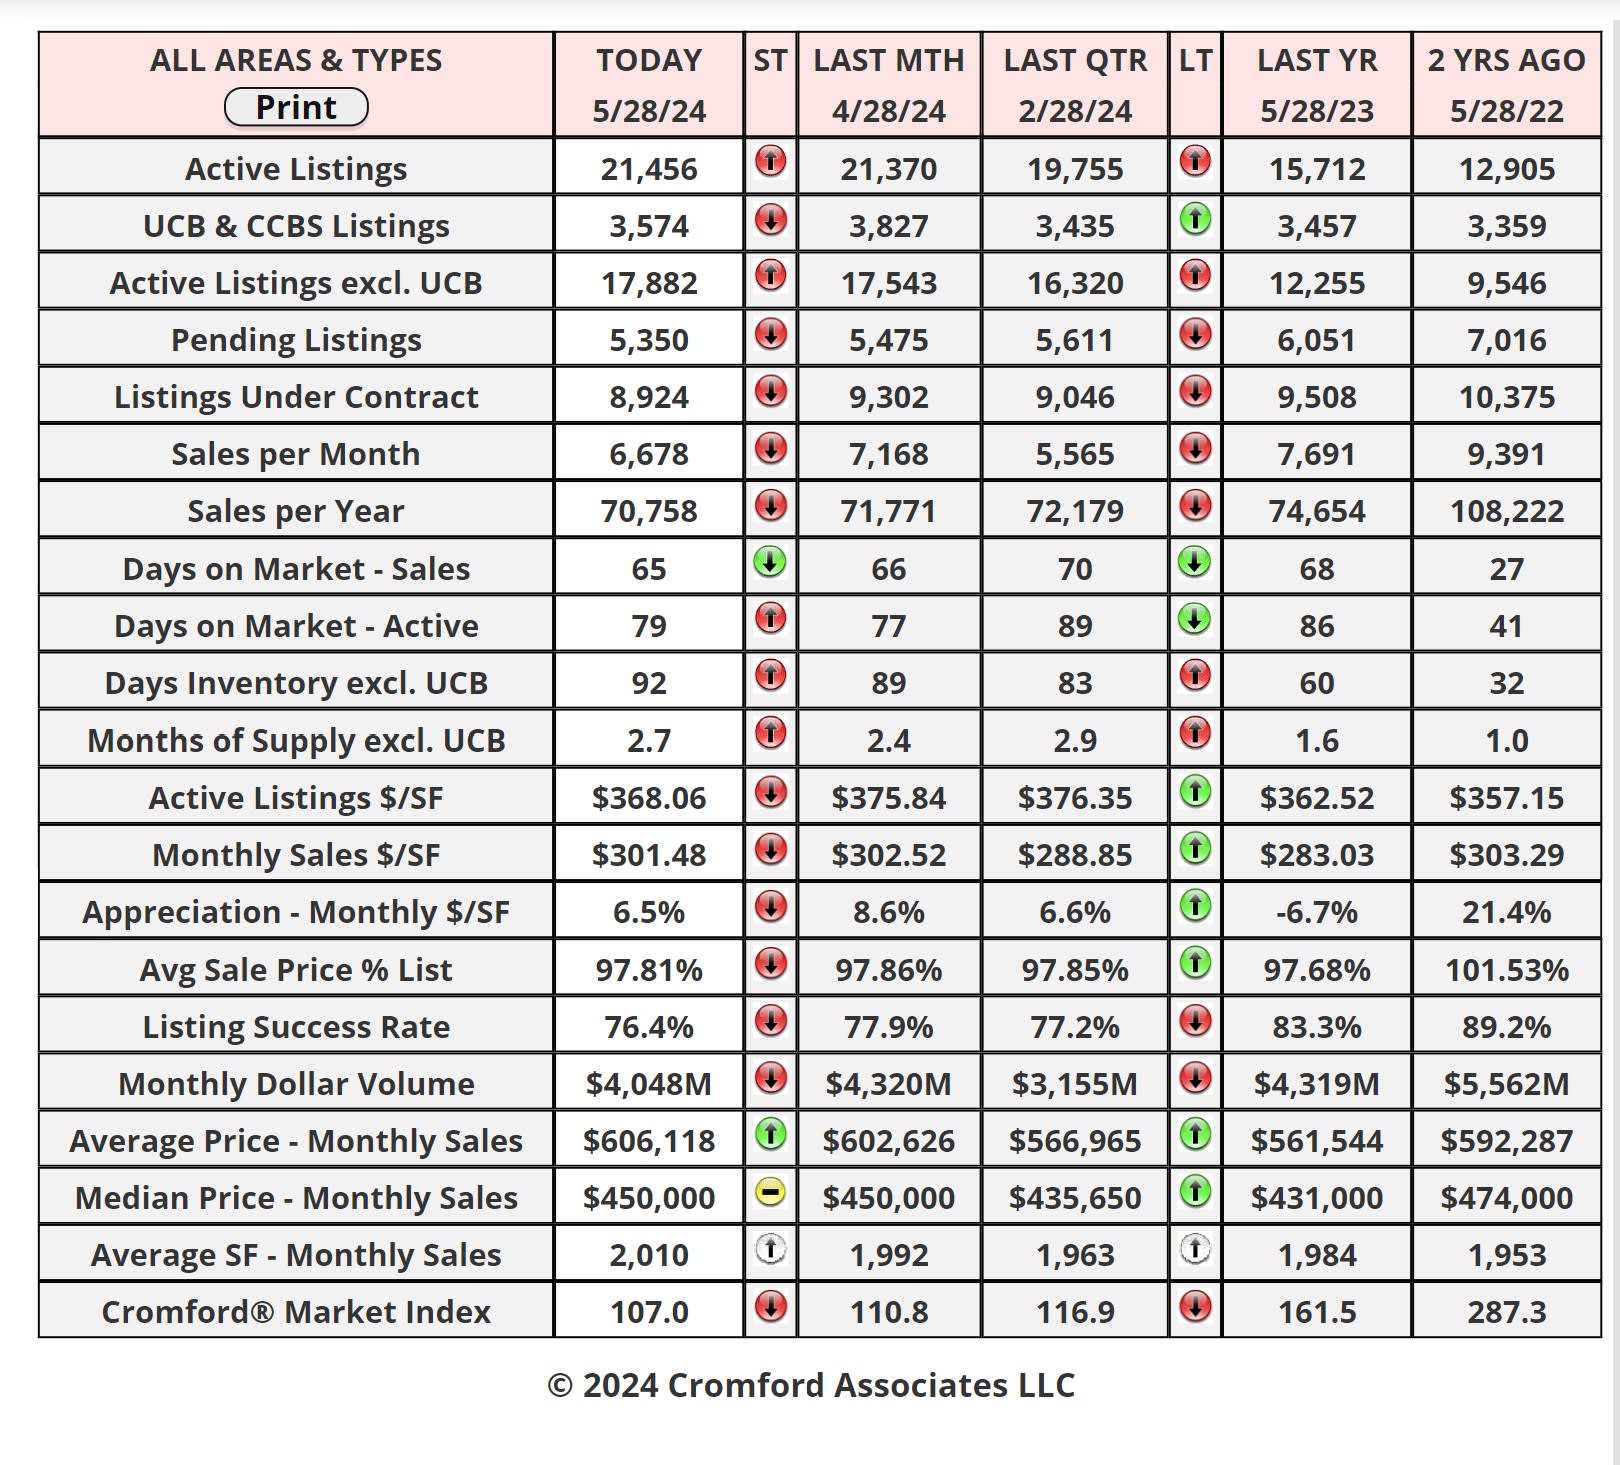
All the statistics shown are for the entire Arizona Regional area as defined by ARMLS. All residential resale transactions
recorded by ARMLS are included. Geographically, this includes Maricopa county, a large part of Pinal county and a small
part of Yavapai county. In addition, "out of area" listings recorded on ARMLS are included, although these usually
constitute a very small percentage of total sales and have very little effect on the data.
All dwelling types are included. For-sale-by-owner, auctions and other non-MLS transactions are not included. Land,
commercial units, and multiple dwelling units are also excluded.
Daily Market Snapshot – City Ranking
area. The figures shown are for the entire Arizona Regional area as defined by ARMLS. All residential resale transactions
recorded by ARMLS are included. Geographically, this includes Maricopa county, the majority of Pinal county and a small
part of Yavapai county. In addition, "out of area" listings recorded in ARMLS are included, although these constitute a very small percentage (typically less than 1%) of total sales and have very little effect on the statistics.
Cromford Market Index
cities.
Cromford Market Index Commentary
The average change in CMI over the past month is +0.1%, down from +0.8 last week and continuing the downward
trend that started last week.
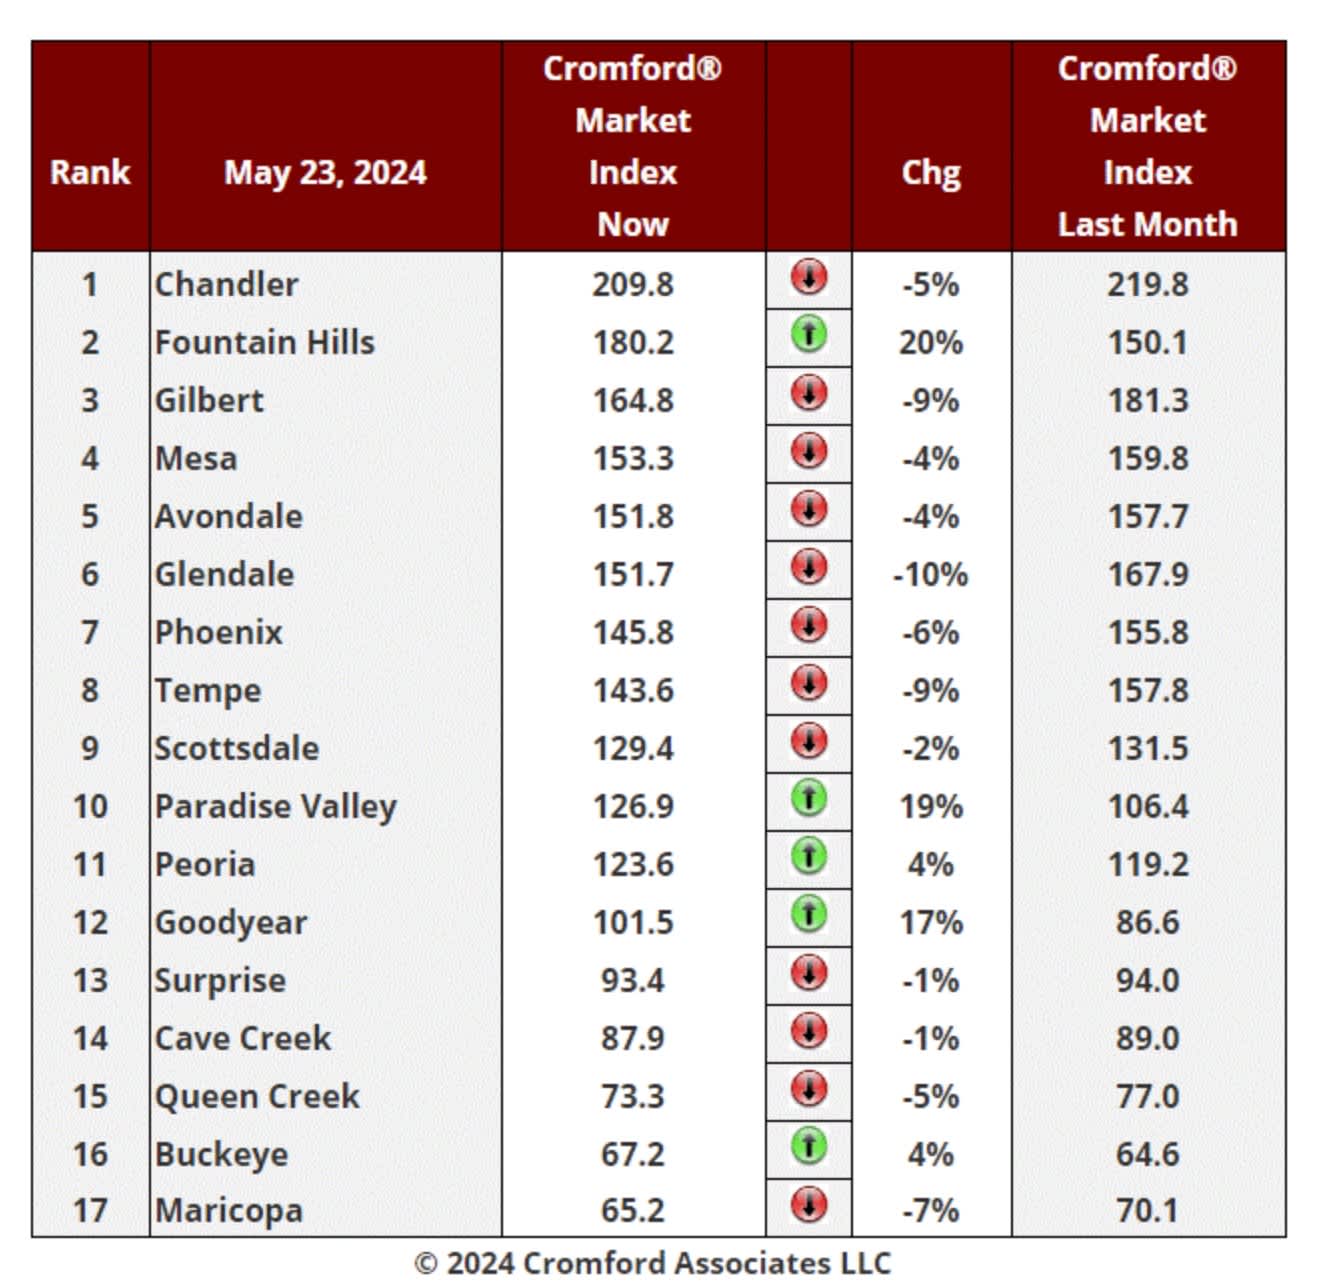
We have only 5 cities showing an increase in their Cromford® Market Index over the past month, while 12 have
declined. This is also less positive than last week.
Paradise Valley, Fountain Hills and Goodyear are the biggest movers in favor of sellers. Tempe, Glendale, Gilbert
and Maricopa are the primary locations moving in favor of buyers.
Now that Chandler is losing steam, Fountain Hills has a chance to replace it at the top of the table.
11 out of 17 cities are seller's markets. We have 2 cities (Goodyear and Surprise) that are balanced, while 4 are
buyer's markets.
Latest S&P / Case-Shiller Home Price Index
May 28 - The latest S&P / Case-Shiller® Home Price Index® numbers were published this Tuesday.
The new report covers home sales during the period January to March 2024. This means the typical home sale
closed in mid February, more than 3 months ago. Please remember that Case-Shiller data is fairly old, even on the
day it is released.
A big turn-around has taken place in the last 2 months. We have all 20 cities showing rising prices for last month.
The Pacific coast had another remarkably strong month.
Comparing with the previous month's series we see the following changes:
1. Seattle +2.70%
2. San Francisco +2.59%
3. Cleveland +2.40%
4. San Diego +2.23%
5. Boston +1.88%
6. Los Angeles +1.70%
7. Chicago +1.66%
8. New York +1.50%
9. Portland +1.47%
10. Minneapolis +1.34%
11. Denver +1.33%
12. Washington +1.27%
13. Dallas +1.19%
14. Atlanta +1.15%
15. Detroit +1.14%
16. Miami +0.96%
17. Charlotte +0.96%
18. Las Vegas +0.92%
19. Phoenix +0.53%
20. Tampa +0.50%
Phoenix has fallen from 14th to 19th place since last month. The national average increase month to month
was 1.29%, so Phoenix under-performed significantly against that benchmark.
Comparing year over year, we see the following changes:
1. San Diego +11.1%
2. New York +9.2%
3. Cleveland +8.8%
4. Los Angeles +8.8%
5. Boston +8.7%
6. Chicago +8.7%
7. Miami +8.2%
8. Seattle +7.8%
9. Detroit +7.7%
10. Las Vegas +7.7%
11. Charlotte +7.5%
12. Washington +7.0%
13. Atlanta +6.1%
14. Phoenix +4.9%
15. San Francisco +4.9%
16. Tampa +3.8%
17. Dallas +3.6%
18. Minneapolis +3.3%
19. Portland +2.2%
20. Denver +2.1%
Phoenix stayed at 14th place, and is therefore still in the bottom half on a year over year basis. All 20 of the cities
are again showing positive price movement from one year ago with Denver and Portland at the bottom. Southern
California and the North are in the lead.
The national average is +6.5% year over year. Phoenix is below that percentage, and in a similar situation to last
month.
30 Year Mortgage Commentary
May 27 - The typical 30-year fixed mortgage rate has been varying between 7% and 7.25% since May 6, which is
better for buyers than the 7.25% to 7.5% range that we saw between April 11 and May 6.
Despite the better rates, demand has stayed weak and even weakened a little further. The number of listings under
contract across all types and areas within the ARMLS database is 8,779. This is down 7% from the 9,441 we saw
on April 27. It is also down almost 10% from this time last year.
As we approach the hottest months of the year, when demand tends to fall anyway, this weakness is not
encouraging. Supply continues to rise, although slowly and the current trends are suggesting continued
deterioration for sellers. It would not be a surprise if demand were to fall enough to match the supply of active
listings over the next several weeks.