
Market Statistics Report for
November 21, 2023
Market Dashboard
This Dashboard provides a comprehensive summary of the current state of the overall residential resale market.
All the statistics shown are for the entire Arizona Regional area as defined by ARMLS. All residential resale transactions recorded by ARMLS are included. Geographically, this includes Maricopa county, a large part of Pinal county and a small part of Yavapai county. In addition, "out of area" listings recorded on ARMLS are included, although these usually constitute a very small percentage of total sales and have very little effect on the data. All dwelling types are included. For-sale-by-owner, auctions and other non-MLS transactions are not included. Land, commercial units, and multiple dwelling units are also excluded.
Daily Market Snapshot – City Ranking
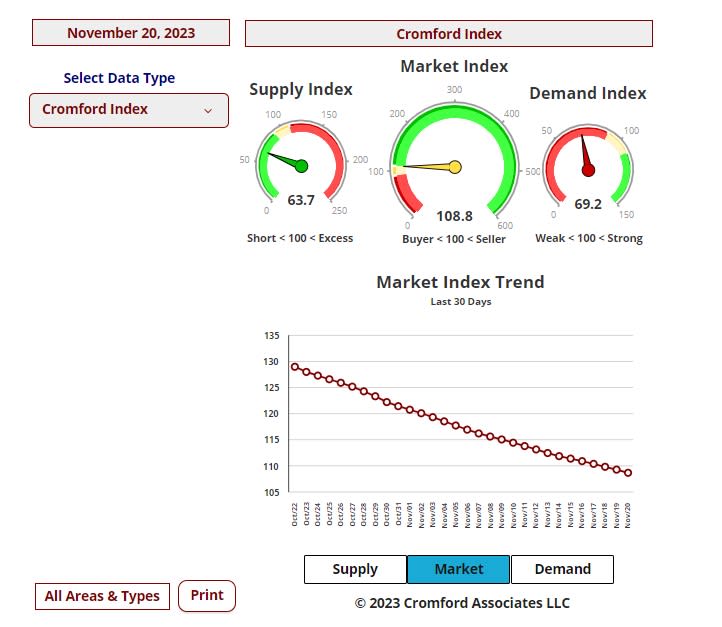
The table below provides a concise statistical summary of today's residential resale market in the Phoenix metropolitan area. The figures shown are for the entire Arizona Regional area as defined by ARMLS. All residential resale transactions recorded by ARMLS are included. Geographically, this includes Maricopa county, the majority of Pinal county and a small part of Yavapai county. In addition, "out of area" listings recorded in ARMLS are included, although these constitute a very small percentage (typically less than 1%) of total sales and have very little effect on the statistics.
Market Index
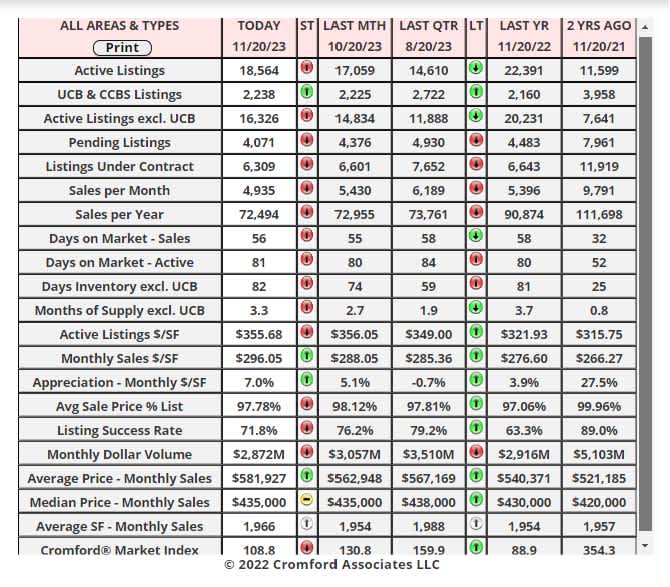
Nov 9 - Here is our latest table of Cromford® Market Index values for the single-family markets in the 17 largest cities.
Market Index Commentary:
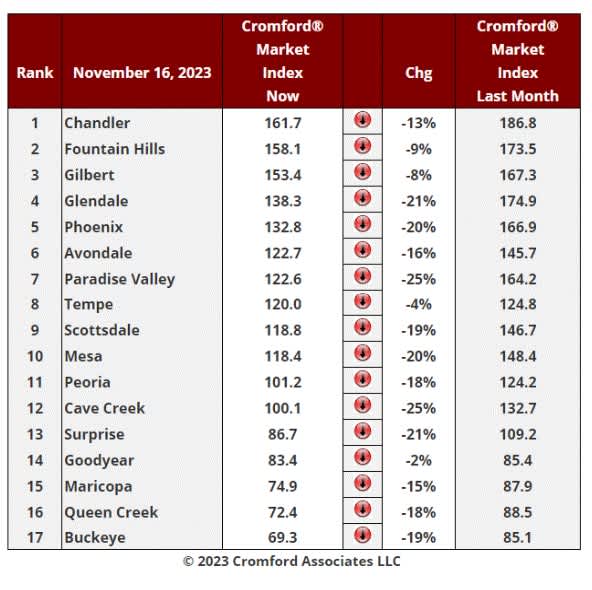
Nov 19 - The Cromford® Market Index for all areas & types has fallen from 113.9 to 109.4 over the last 7 days and is now within the balanced zone of 90 to 110.
It is currently still in a downward trend with supply rising and demand falling. Seasonal patterns make it likely that this downtrend will flatten out over the next 6 weeks, but we will have to wait and see if this materializes.
Nov 16 - There was an average decline of 16.1% in the Cromford® Market Index for the 17 cities above. This is slightly less bad than the 16.3% decline we saw last week.
Well above average declines in CMI can be seen in Cave Creek, Buckeye, Mesa, Scottsdale, Glendale, Paradise Valley, Surprise and Phoenix. The slowest declines are to be found in Goodyear and Tempe. In fact, Goodyear has started to see its CMI rise over the past week.
10 out of 17 cities are still sellers’ markets with Peoria and Cave Creek in the balanced zone while Surprise, Buckeye, Goodyear, Queen Creek and Maricopa are all buyers' markets. Maricopa and Queen Creek are below the 80 level and Buckeye has dropped below 70.
Mid-Month Pricing Update and Forecast
Each month at about this time we look back at the previous month, analyze how pricing has behaved and report on how well our forecasting techniques performed. We also give a forecast for how pricing will move over the next month.
For the monthly period ending November 15, we are currently recording a sales $/SF of $297.10 averaged for all areas and types across the ARMLS database. This is up 3.4% from the $287.21 we now measure for October 15. Our forecast range mid-point was $291.00, so this month we significantly underestimated the price increase that would occur between mid-October and mid-November. The actual result sits just above our 90% confidence range.
On November 15 the pending listings for all areas & types show an average list $/SF of $320.78, almost unchanged from the reading for October 15. Among those pending listings we have 99.2% normal, 0.2% in REOs and 0.6% in pre-foreclosures. This is similar to the last 8 months, and we still have very few distressed sales or foreclosures appearing.
Our mid-point forecast for the average monthly sales $/SF on December 15 is $296.62, which is 0.2% below the November 15 reading. We have a 90% confidence that it will fall within ± 2% of this mid-point, i.e. in the range $290.69 to $302.55.
We expected higher pricing over the past month but were surprised to see a very strong upward move in the face of declining demand. We are forecasting a small decrease in pricing over the next 30 days.
Nov 15 – Demand Information: We have the first signs that demand is starting to recover, thanks to the lower mortgage rates that now prevail. Today we are looking at 7.45% for a typical 30-year fixed loan and 6.77% for FHA. These are still not great rates, but preferable to the 7.88% and 7.31% that prevailed on October 31.
Today's contract ratio for all areas & types is 40.56, up from 37.46 on November 4. It is still lower than a month ago, but the trend has changed direction. It had been in clear decline between late May and early November.
Supply usually weakens each year once we get to Thanksgiving. If demand can hold its current trend, then we are optimistic that the weakening market can stabilize by the end of the year. Of course, all bets are off if interest rates move higher again.