
Market Statistics Report for
November 7, 2023
Market Dashboard
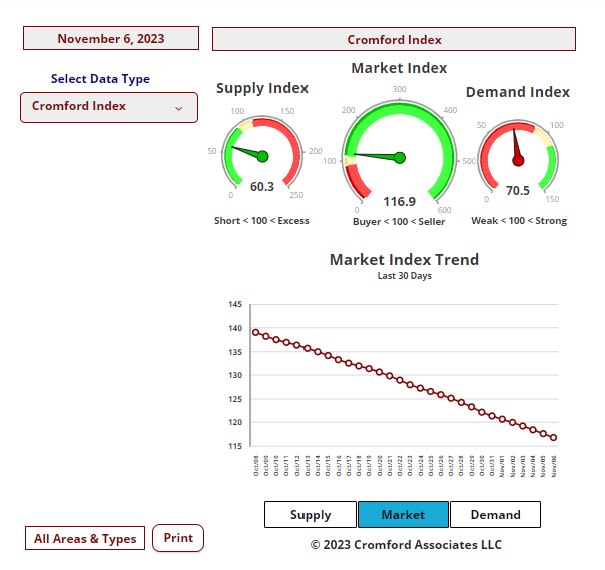
This Dashboard provides a comprehensive summary of the current state of the overall residential resale market.
All the statistics shown are for the entire Arizona Regional area as defined by ARMLS. All residential resale transactions recorded by ARMLS are included. Geographically, this includes Maricopa county, a large part of Pinal county and a small part of Yavapai county. In addition, "out of area" listings recorded on ARMLS are included, although these usually constitute a very small percentage of total sales and have very little effect on the data. All dwelling types are included. For-sale-by-owner, auctions and other non-MLS transactions are not included. Land, commercial units, and multiple dwelling units are also excluded.
Daily Market Snapshot – City Ranking
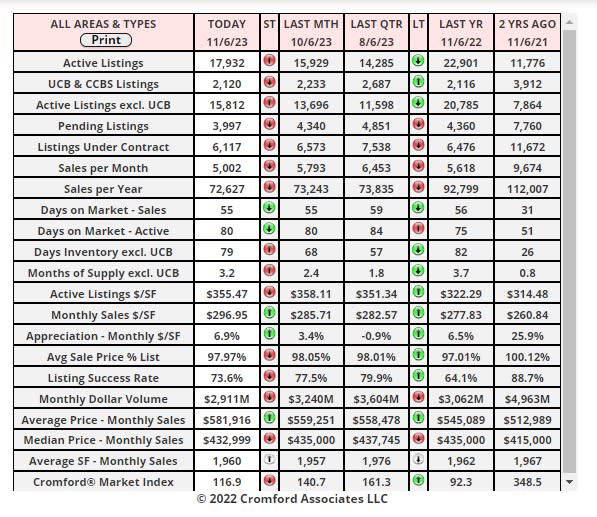
The table below provides a concise statistical summary of today's residential resale market in the Phoenix metropolitan area. The figures shown are for the entire Arizona Regional area as defined by ARMLS. All residential resale transactions recorded by ARMLS are included. Geographically, this includes Maricopa county, the majority of Pinal county and a small part of Yavapai county. In addition, "out of area" listings recorded in ARMLS are included, although these constitute a very small percentage (typically less than 1%) of total sales and have very little effect on the statistics.
Market Index
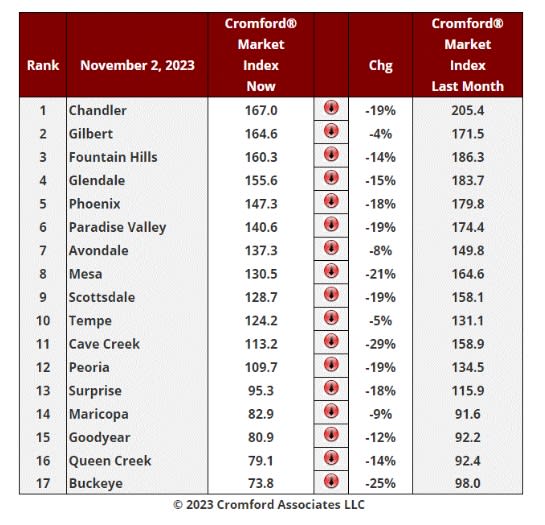
Nov 2 - Here is our latest table of Cromford® Market Index values for the single-family markets in the 17 largest cities.
Market Index Commentary:
The market is still weakening and at a faster rate, with an average decline of 15.8% in the Cromford® Market Index for the 17 cities above. This is worse than the 14.5% decline we saw last week.
Well above average declines in CMI can be seen in Cave Creek, Buckeye, Mesa, Scottsdale, Paradise Valley, Chandler, Peoria, Surprise and Phoenix. Falling but at a lower speed are Gilbert, Avondale, Maricopa and Tempe.
11 out of 17 cities are still sellers’ markets with Peoria and Surprise in the balanced zone while Buckeye, Goodyear, Queen Creek and Maricopa are all buyers' markets. Queen Creek has joined Buckeye below the 80 level. Among the secondary cities, Casa Grande is also below 80 while Gold Canyon and Litchfield Park are below 90.
Tolleson, Laveen, Anthem, El Mirage and Apache Junction are the strongest of the secondary cities with CMIs over 190.
Monthly Average Sales Price Per Square Foot:
Nov 6 - Despite the plunging Cromford® Market Index, pricing trends have been largely favorable over the past 2 months. Here is the 6-month chart showing daily readings for the active listing average $/SF, under contract average $/SF, closed list price average $/SF and closed sale price average $/SF.
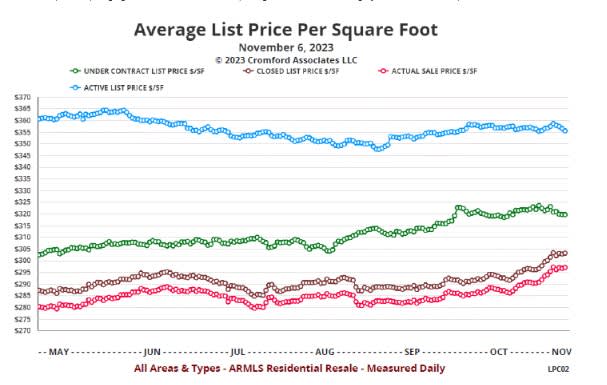
The active listing $/SF is lower than it was 6 months ago, but that follows the usual seasonal pattern with a weak 3Q followed by a mild recovery. The current trend is pretty flat with optimistic new listing prices being balanced by price cuts for existing listings that have remained on the market for more than a few weeks.
Under contract $/SF is a lot higher than it was 6 months ago, around $320 compared with $302, a rise of around 6%. However, the trend for the last month has flattened.
The list $/SF for closed listings stands at $303, up from $287 six months ago, a rise of just under 6%.
The sale $/SF for closed listings stands at $297, up from $280 six months ago, a rise of just over 6%.
Closed listings are achieving a slightly higher percentage of the final asking price compared with 6 months ago. It is up from 97.58% to 97.97%, a positive sign.
Since the end of August, the gap between the under contract line (green) and the closed line (brown) has been too big. When this happens, it is safe to predict the gap will close. In this case, prices for closed listings rose significantly while under contract prices remained stable. The gap is now back to normal. Closed prices are unlikely to rise much further from this point unless under contract prices establish an upward trend again. Given the balance between supply and demand, it seems more likely that under contract pricing will weaken, but we will have to wait and see what recent moves in interest rate do to buyer enthusiasm.
The Affidavit of Value Record October - Commentary
Nov 3 - The Affidavit of Value recorded during October by Maricopa County have now been analyzed and show us the following:- There were 5,543 closed transactions, down 8% from 6,019 in October 2022 and down 6% from September.
- There were 1,480 closed new homes, up 5% from 1,410 in October 2022 but down 9% from September.
- There were 4,063 closed re-sale transactions, down 12% from 4,609 in October 2022 and down 5% from September.
- The overall median sales price in October was $470,000, unchanged from October 2022 and up 4.4% from September.
- The re-sale median sales price was $445,000, down 0.6% from October 2022 but up 1.1% from September.
- The new home median sales price was $538,422, up 1.8% from October 2022 and up 12% from September.
New home sales have remained resilient and grew year over year, despite the extremely weak demand in the re- sale market.
Unlike the last 2 months, the new home numbers were not impacted by large buy-to-rent transactions with low unit prices. Consequently, the new home median sales price jumped to $538,422, the highest we have ever recorded. It is not that there were no BTR transactions in September - they were just sold at more normal new home prices.
These numbers are for single family and townhouse / condo homes.