
Market Statistics Report for
October 11, 2023
Market Dashboard
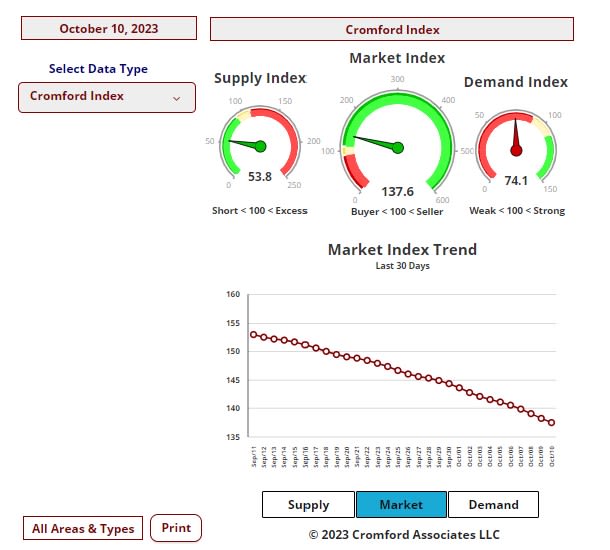
This Dashboard provides a comprehensive summary of the current state of the overall residential resale market.
All the statistics shown are for the entire Arizona Regional area as defined by ARMLS. All residential resale transactions recorded by ARMLS are included. Geographically, this includes Maricopa county, a large part of Pinal county and a small part of Yavapai county. In addition, "out of area" listings recorded on ARMLS are included, although these usually constitute a very small percentage of total sales and have very little effect on the data. All dwelling types are included. For-sale-by-owner, auctions and other non-MLS transactions are not included. Land, commercial units, and multiple dwelling units are also excluded.
Daily Market Snapshot – City Ranking
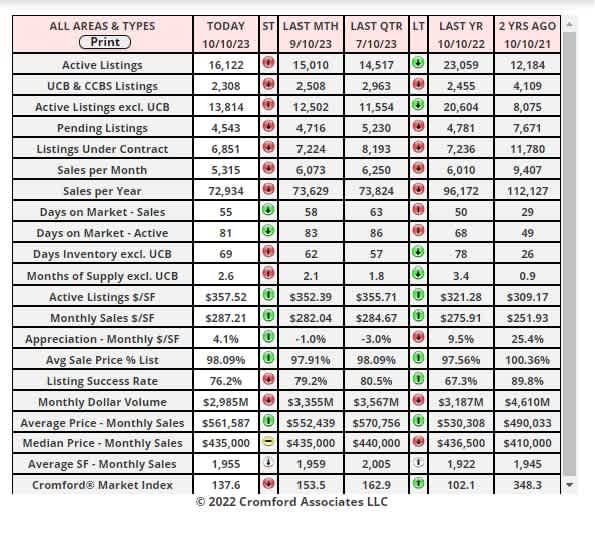
The table below provides a concise statistical summary of today's residential resale market in the Phoenix metropolitan area. The figures shown are for the entire Arizona Regional area as defined by ARMLS. All residential resale transactions recorded by ARMLS are included. Geographically, this includes Maricopa county, the majority of Pinal county and a small part of Yavapai county. In addition, "out of area" listings recorded in ARMLS are included, although these constitute a very small percentage (typically less than 1%) of total sales and have very little effect on the statistics.
Market Index
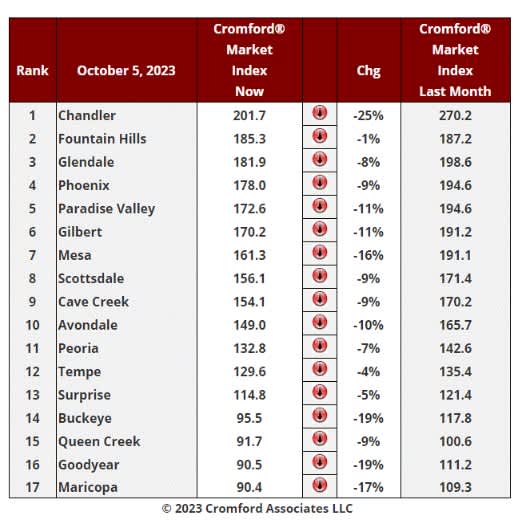
Oct 5 - Here is our latest table of Cromford® Market Index values for the single-family markets in the 17 largest cities.
Market Index - Commentary
This is the most dismal table for sellers we have posted since November 10 last year. All 17 cities have seen their CMI drop over the last month, meaning that power is slipping away from sellers and moving towards buyers.
We do not have to look far to find the most obvious reason - mortgage interest rates. While most pundits predicted rates would fall in the second half of 2023, the shortage of buyers for bonds have caused yields to rise. The typical 30-year fixed mortgage rate is now around 7.7%, up from 7.3% a month ago. Understandably, buyers are far from enthusiastic about this and in some cases fail affordability tests they could once have passed easily.
This is not the whole story however, because supply is now rising at the fastest rate we have seen since last year. A combination of lower demand and higher supply means the average CMI in the table has fallen by 11.2%, well above the 9.4% drop we measured last week and 7.8% two weeks ago.
Well above average declines can be seen in Chandler, Goodyear, Buckeye, Maricopa and Mesa. Falling but at a much lower speed are Fountain Hills, Tempe and Surprise.
13 out of 17 cities are still sellers markets (for now) with Buckeye, Goodyear, Queen Creek and Maricopa in the balanced zone. However, these 4 cities are now below the 100 mark implying that buyers have a slight edge in negotiations. On the current trajectory, these 4 could all be confirmed as buyers' markets before the end of the month.
Among the secondary cities, Laveen and Tolleson did manage small increases in their CMI, but the other 10 cities declined like their larger counterparts.
Inventory - Commentary
Oct 8 - For much of this year, the new listing counts have been extremely low - often more than 40% below the same period in 2022. We saw somewhere between 6,500 and 7,500 new listings every 28 days between May 25 and Oct 2. Since Oct 3, we have been measuring slightly over 7,500 listings per 28 days. The normal level is 9,500 to 11,000. So, we are still far below normal for the time of year, but not as far down as for the last 4 months.The extra new listings are coming just as demand takes another leg down, which means the active listing pool is getting more input and less output. You would therefore expect the active listing count to grow, and you would be correct. For all areas & types we saw 13,901 active listings without a contract on Saturday, up 13,432 a week earlier and 13,103 the week before that.
With monthly and annual sales counts dropping, inventory measures such as months of supply and days of inventory are increasing. Though they are still below normal, the competition among sellers is growing and the buyers that remain have more choice. The market is softer than during the second and third quarters and upward pressure on prices is dissipating.