
Market Statistics Report for
October 25, 2023
Market Dashboard
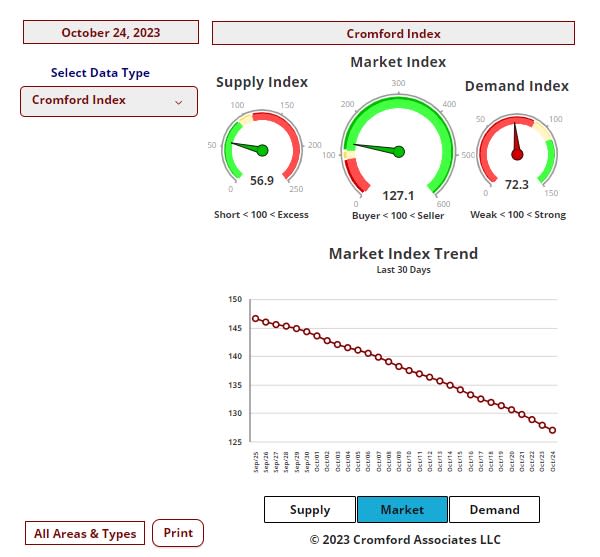
This Dashboard provides a comprehensive summary of the current state of the overall residential resale market.
All the statistics shown are for the entire Arizona Regional area as defined by ARMLS. All residential resale transactions recorded by ARMLS are included. Geographically, this includes Maricopa county, a large part of Pinal county and a small part of Yavapai county. In addition, "out of area" listings recorded on ARMLS are included, although these usually constitute a very small percentage of total sales and have very little effect on the data. All dwelling types are included. For-sale-by-owner, auctions and other non-MLS transactions are not included. Land, commercial units, and multiple dwelling units are also excluded.
Daily Market Snapshot – City Ranking
The table below provides a concise statistical summary of today's residential resale market in the Phoenix metropolitan area. The figures shown are for the entire Arizona Regional area as defined by ARMLS. All residential resale transactions recorded by ARMLS are included. Geographically, this includes Maricopa county, the majority of Pinal county and a small part of Yavapai county. In addition, "out of area" listings recorded in ARMLS are included, although these constitute a very small percentage (typically less than 1%) of total sales and have very little effect on the statistics.
Market Index
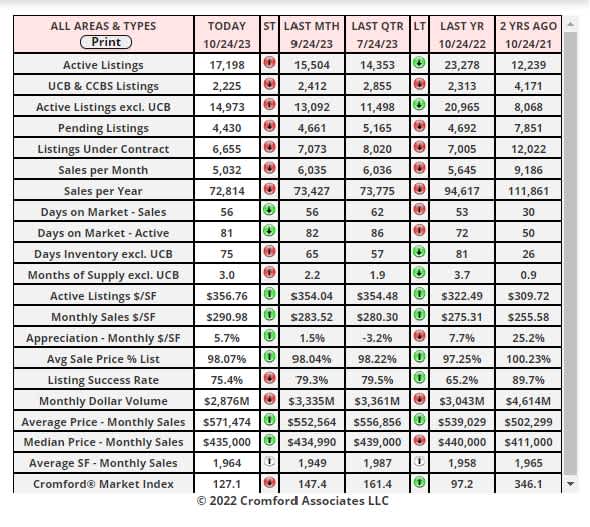
Oct 19 - Here is our latest table of Cromford® Market Index values for the single-family markets in the 17 largest cities.
Market Index Commentary:
All 17 cities have seen their CMI drop over the last month, meaning that power is quickly slipping away from sellers and moving towards buyers. The average CMI in the table has fallen by 13.4%, well above the 11.2% we measured two weeks ago.
Although almost all pundits predicted rates would fall in the second half of 2023, the typical 30-year fixed mortgage rate is now around 8.03%, up from 7.33 a month ago. In historical terms, this is unexceptional, but the majority of home-buyers are too young to have experienced rates at this level before. Unless they are working with a seller who is prepared to buy-down their interest rate, the majority of buyers lack enthusiasm to jump in at this point and many are choosing to wait until times get easier. People would still like to buy a home eventually, so latent demand
is rising while actual demand falls.
Supply is now rising at the fastest rate so far this year. The combination of lower demand and higher supply is just what sellers don't want.
Well above average declines in CMI can be seen in Chandler, Cave Creek, Buckeye and Mesa. Falling but at a lower speed are Gilbert, Avondale, Glendale, Queen Creek, Fountain Hills, Tempe and Surprise.
12 out of 17 cities are still sellers’ markets with Surprise in the balanced zone while Buckeye, Goodyear, Queen Creek and Maricopa are all confirmed as buyers' markets.
Market Index Commentary:
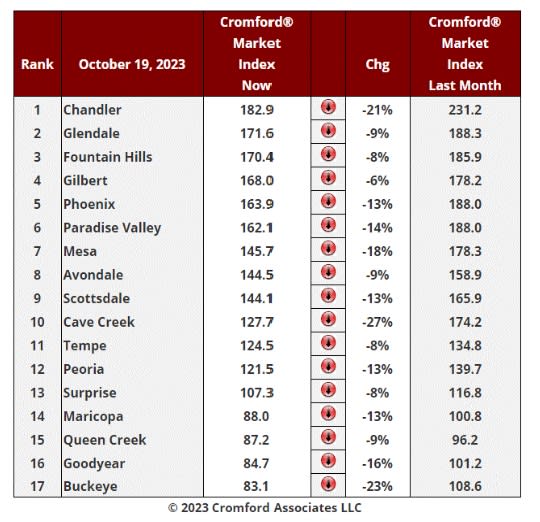
Oct 21 - The chart below shows us quite how emphatically the housing market hates interest rates at 8%.
As recently as 3 weeks ago, we had just over 2 months of supply. Now we are headed over 3 months, and we should all know that 3.5 to 4.5 months represents a balanced market. At the current rate of change we are only 2 weeks away from that range.
Calculating months of supply involves 2 numbers:
1. The number of active listings (in this chart we have excluded those in UCB or CCBS status).
2. The monthly sales rate.
3. Item number one is now growing quickly after a long period of weakness.
Item number two is in a long-term downtrend as demand continues to drop.
Both numbers are working together to push months of supply sharply higher.
Market Index Spotlight:
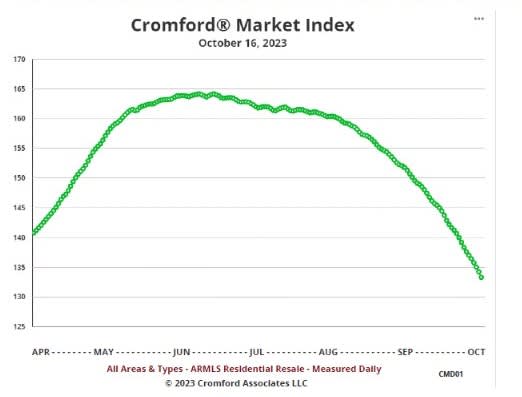
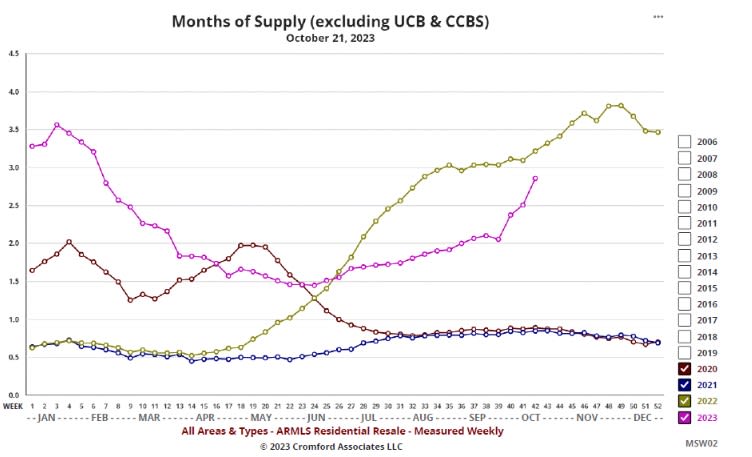
Oct 17 - The Cromford® Market Index managed to stay above 160 until August 19, but since then it has declined at an accelerating rate in the face of increasingly unattractive mortgage interest rates.
The 30-year jumbo rate has already breached 8% and the 30-year fixed rate looks likely to follow, after jumping higher at the start of this week. Demand has been weak all year, but these rates are driving it to lower levels. At 73.2 the Cromford® Demand Index is the lowest we have recorded since January 11 and is still trending down. In January the Cromford® Supply Index was also heading down fast, keeping the market balanced in favor of sellers. This month we are seeing supply increase, so the balance is shifting in favor of buyers.
Although we are not in the balanced CMI range between 90 and 110 yet, the current trend would place us there within a matter of weeks. This is not a reassuring situation for sellers and their confidence is much weaker than it was a couple of months ago. Buyers have a better negotiating position but those needing finance are increasingly dismayed at the cost of their monthly repayment. Both sides are unhappy, leading to weakening transaction volumes and lower closing rates. This spreads the hurt across all sectors of the housing industry. New home builders are the least affected, since they have the financial resources to buy-down the interest rates for their customers and so maintain better sales volumes and pricing.
The listing success rate has declined to around 76% after staying over 80% until the end of July. The positive news is that it has not dropped to the level of this time last year, when we are seeing success rates in the low 60s.