
Market Statistics Report for
October 3, 2023
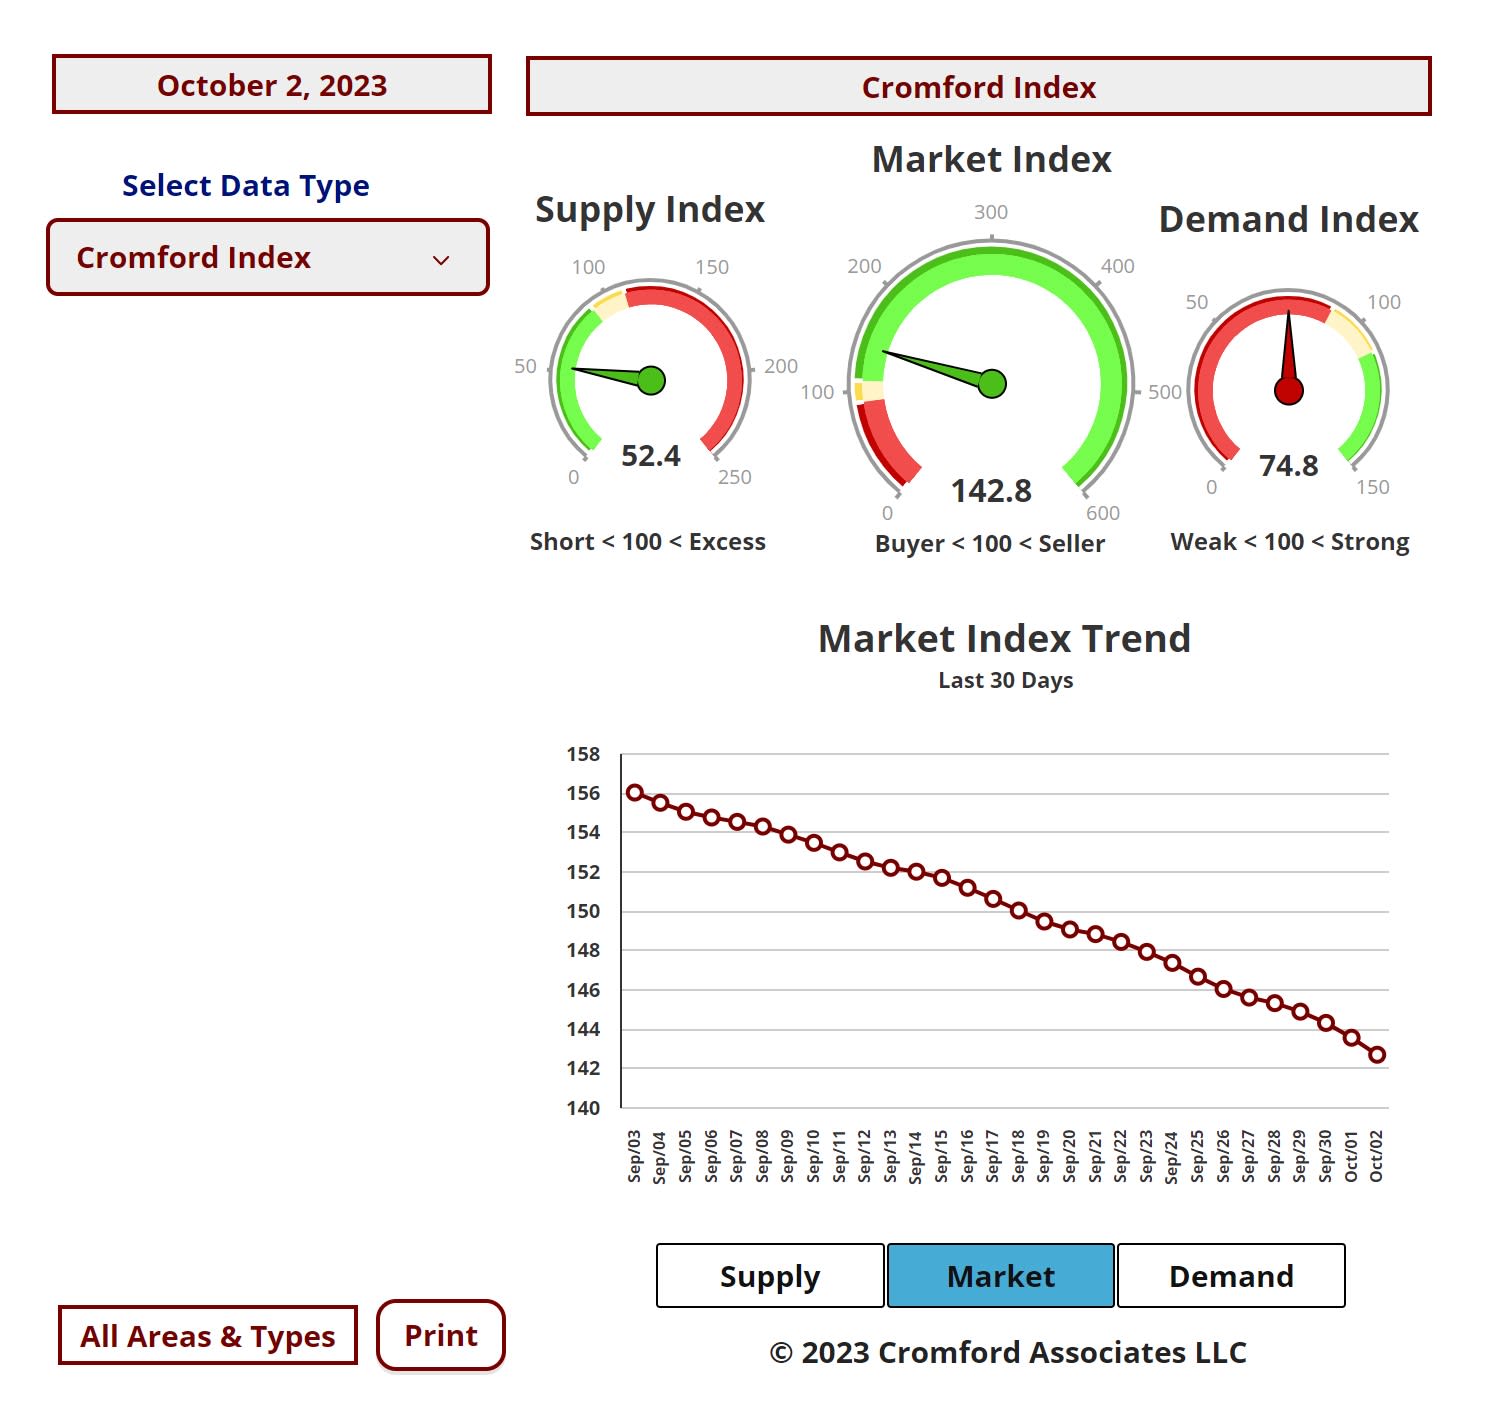
Market Dashboard
This Dashboard provides a comprehensive summary of the current state of the overall residential resale market.
All the statistics shown are for the entire Arizona Regional area as defined by ARMLS. All residential resale transactions recorded by ARMLS are included. Geographically, this includes Maricopa county, a large part of Pinal county and a small part of Yavapai county. In addition, "out of area" listings recorded on ARMLS are included, although these usually constitute a very small percentage of total sales and have very little effect on the data. All dwelling types are included. For-sale-by-owner, auctions and other non-MLS transactions are not included. Land, commercial units, and multiple dwelling units are also excluded.
Daily Market Snapshot – City Ranking
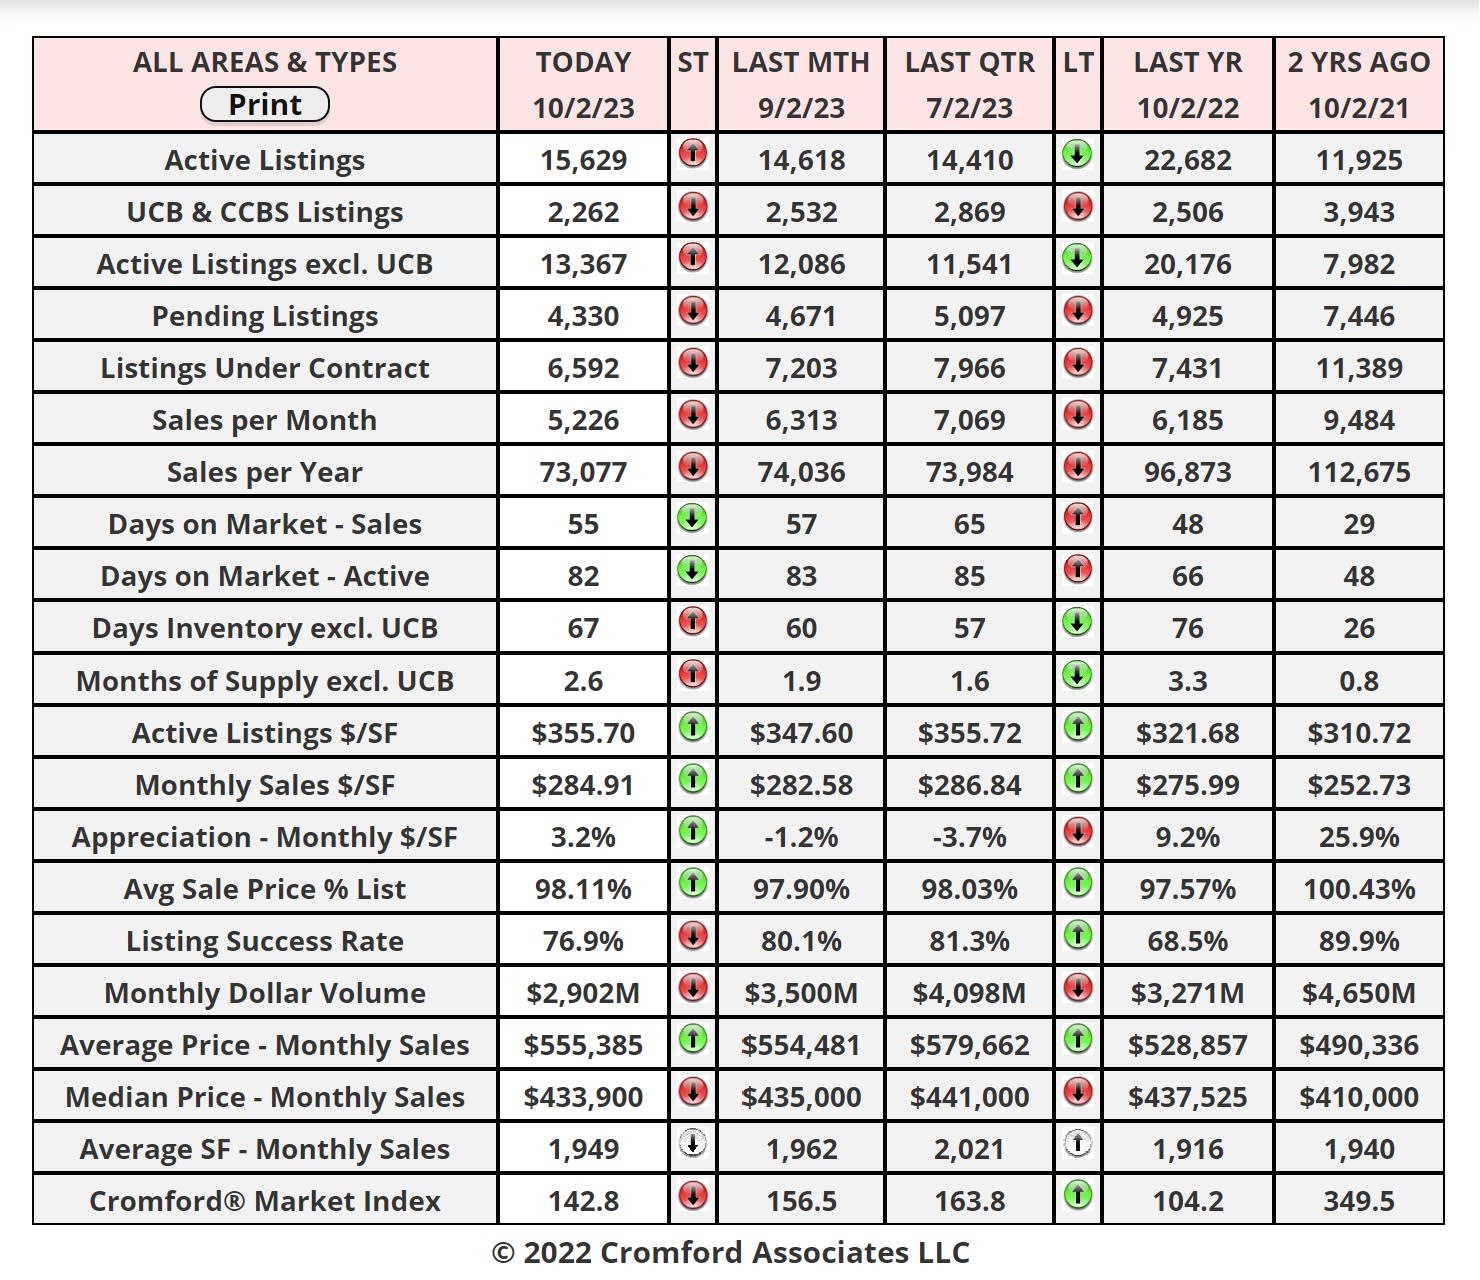
The table below provides a concise statistical summary of today's residential resale market in the Phoenix metropolitan area. The figures shown are for the entire Arizona Regional area as defined by ARMLS. All residential resale transactions recorded by ARMLS are included. Geographically, this includes Maricopa county, the majority of Pinal county and a small part of Yavapai county. In addition, "out of area" listings recorded in ARMLS are included, although these constitute a very small percentage (typically less than 1%) of total sales and have very little effect on the statistics.
Market Index
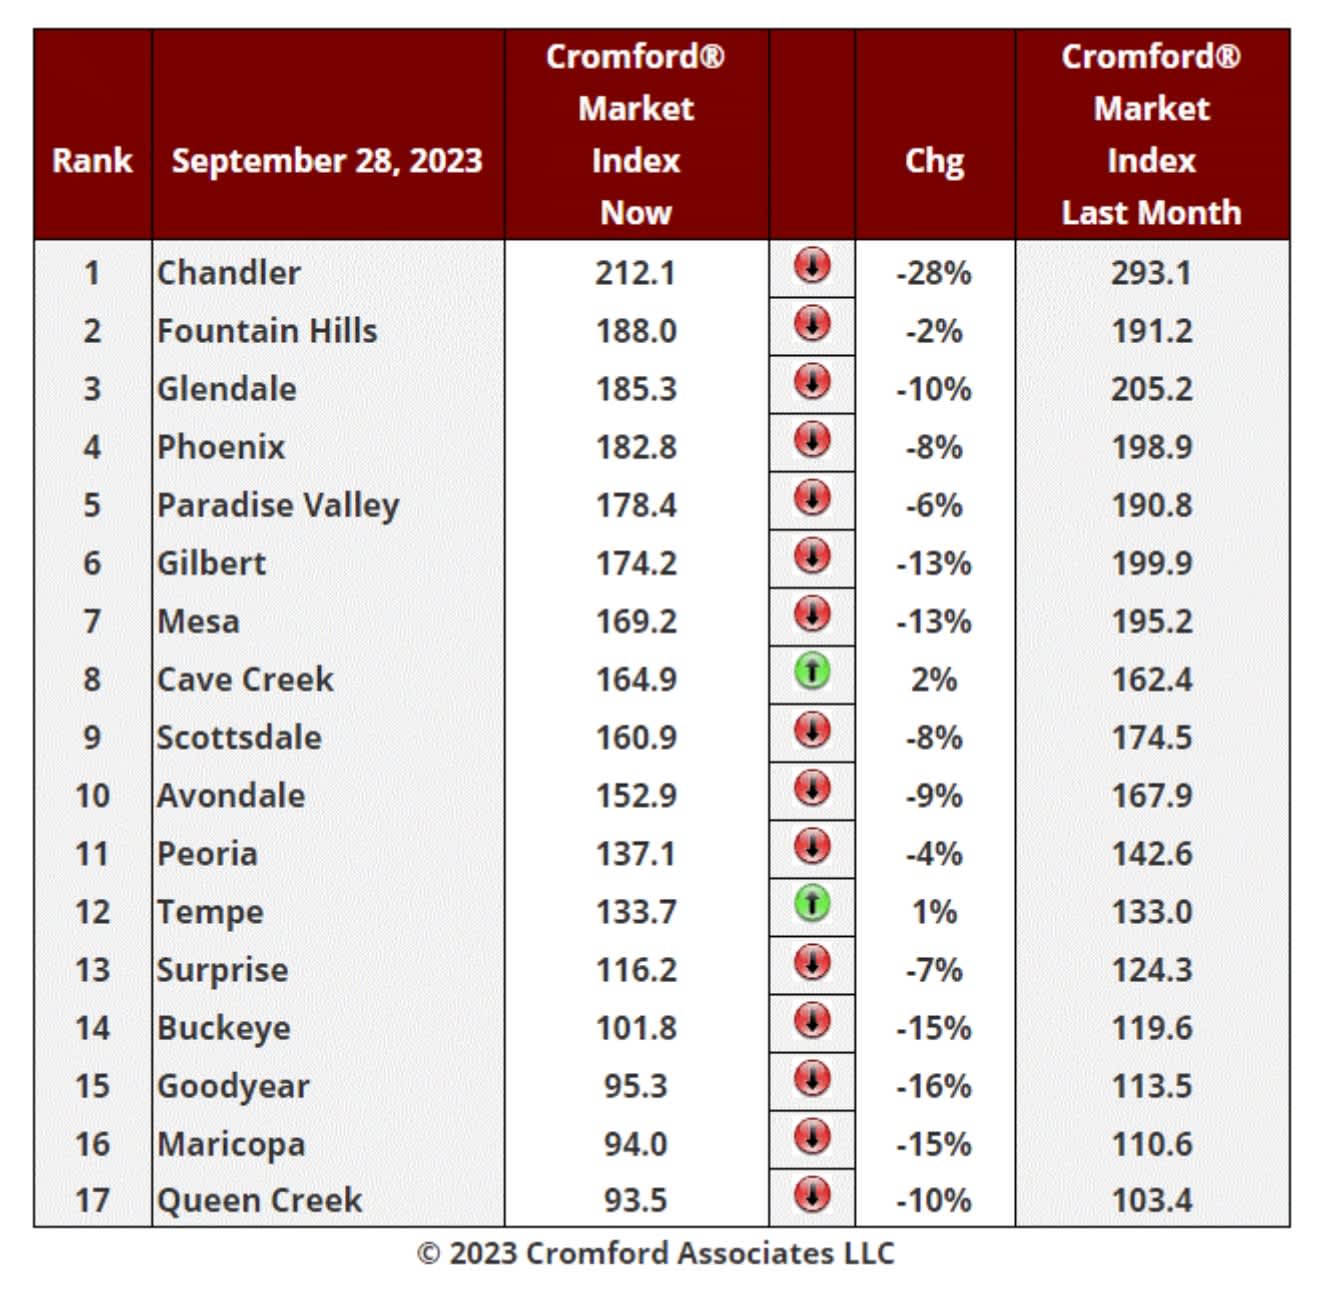
Sept 28 - Here is our latest table of Cromford® Market Index values for the single-family markets in the 17 largest cities.
Market Index - Commentary
We still have 2 cities that moved in a direction favorable to sellers over the last month, Cave Creek and Tempe. However, these 2 are only just positive and their change over the last 2 weeks is unfavorable
for sellers. In any case, these are two of the smallest of the 17 and the general direction of the market is swinging towards buyers. Supply is increasing and demand remains extremely weak.
for sellers. In any case, these are two of the smallest of the 17 and the general direction of the market is swinging towards buyers. Supply is increasing and demand remains extremely weak.
We can also see that the market is becoming more favorable to buyers at an accelerating rate. The average CMI change in these 17 cities over the last month was -9.4%, more negative than last week
when we measured -7.8%.
Most negative again this week is Chandler, down 28%, though it remains in first place. Goodyear, Maricopa, Buckeye, Mesa and Gilbert are also much weaker than this time last month, down at least 13%.
13 out of 17 cities are still sellers’ markets with Buckeye, Goodyear, Queen Creek and Maricopa in the balanced zone. However, 3 of these cities are now below the 100-mark implying that buyers have a
slight edge in negotiations in Goodyear, Maricopa and Queen Creek. On the current trajectory, these 3 could be buyers' markets by mid-October, with Buckeye not far behind.
Supply remains well below normal in most areas, but Maricopa's supply index is now over 100, joining Casa Grande. Litchfield Park looks next to breach the 100 mark for its supply.
Supply is still extremely low in Anthem, Chandler, El Mirage and Gilbert. News and Commentary – Sep 26 – The latest S&P / Case-Shiller® Home Price Index® numbers were published this Tuesday.
Phoenix lies in 19th place, down from 17th last month and among the weakest cities on a year over year basis. More than half the cities are now showing positive price movement from one year ago and
once again the northern cities are looking good on the year over year measure.
The national average is +1.0% year over year.
Year to Date Volume Dollar – Normal vs. New Home Sales Commentary
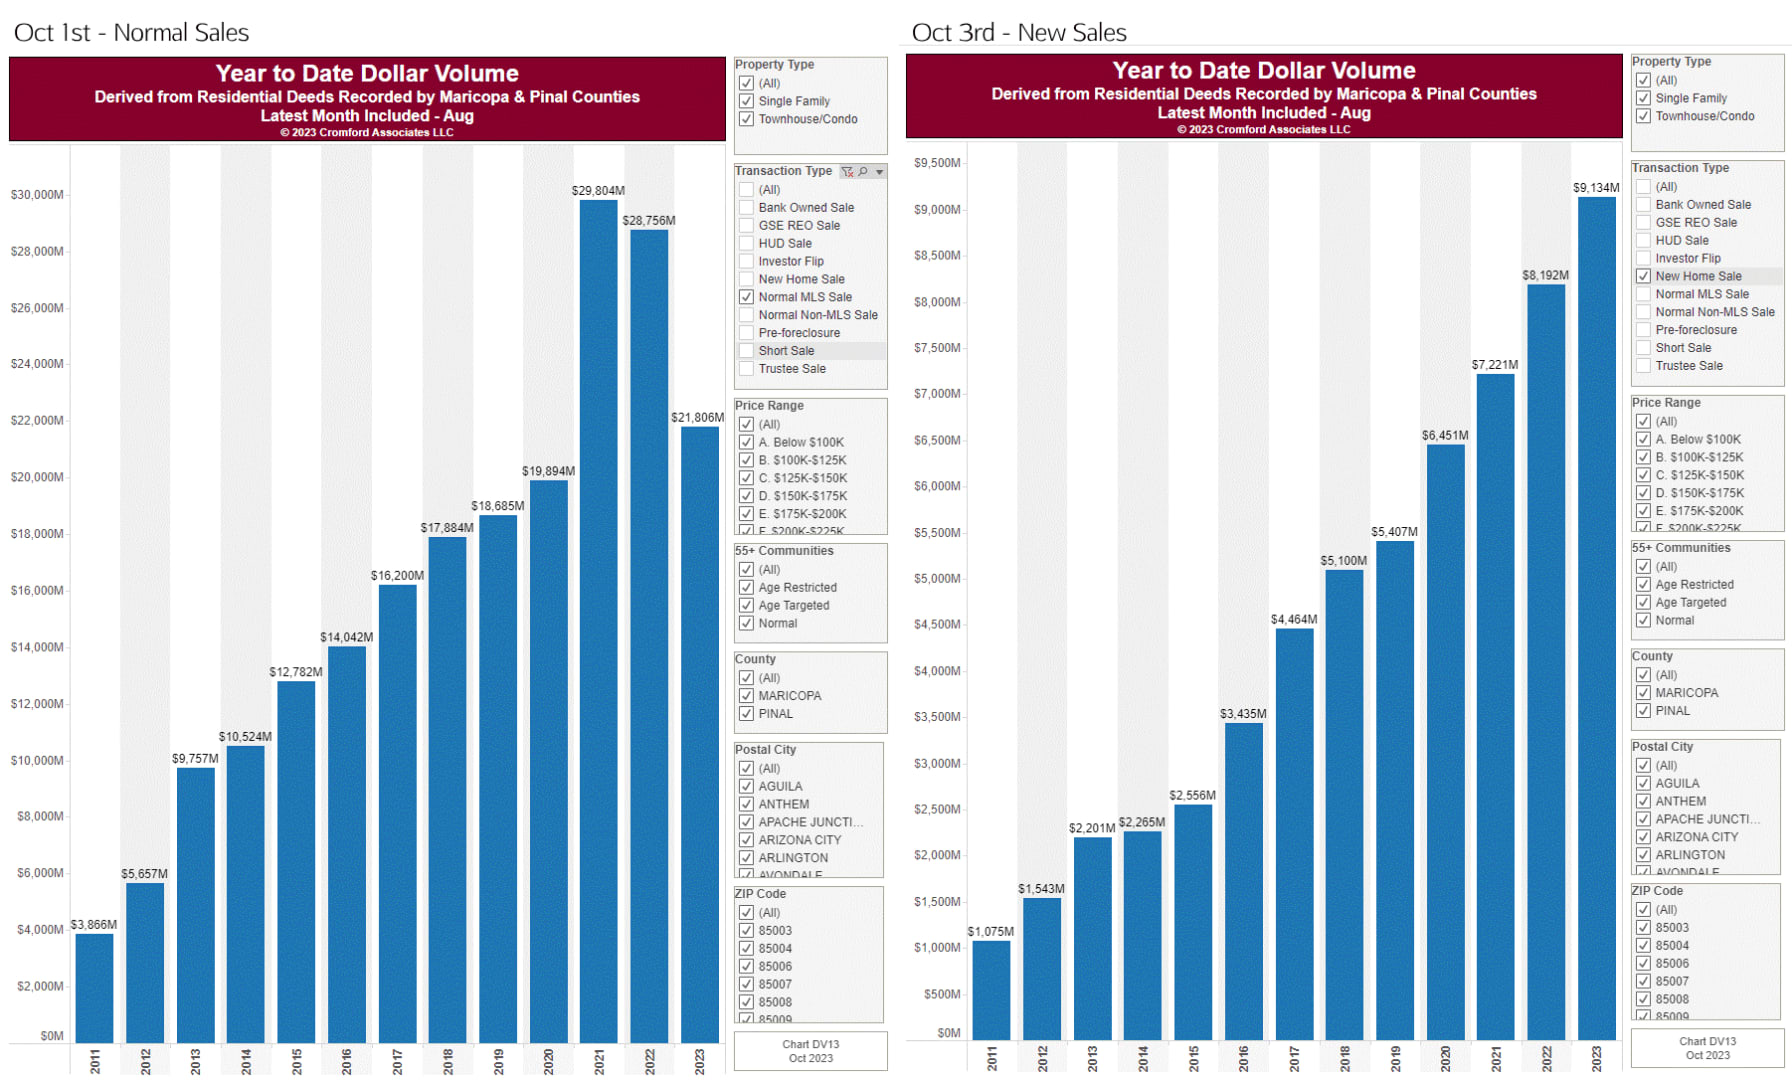
Oct 1st - The dollar volume of closed transactions is shown in the chart below taken from the optional Cromford® Public section of our site. This is for Maricopa and Pinal counties
and we have filtered out all transactions except for Normal re-sales that went through the MLS. The numbers are year-to-date as of the end of August for each year.
and we have filtered out all transactions except for Normal re-sales that went through the MLS. The numbers are year-to-date as of the end of August for each year.
The drop between 2022 and 2023 is 24%. If you are earning 24% less than last year then you are in-line with the market as a whole.
Even though sales volume is down massively, the increase in prices since 2020 means there is still more business (dollars) in 2023 than in 2020.
Oct 3rd - The key difference is that for this one we only included new home closings.
The dollar volume for new homes is not only higher than every prior year, it is up a massive 11.5% from last year. Clearly agents working for developers are not feeling the same
challenges that the rest of the agent community is going through. Business is strong. demand remains good and there is no reluctance to sell due to cheap prior mortgages, because there are no cheap prior mortgages on newly built homes.
In addition, developers are happy to agree to use some of their gross margins to buy-down lower mortgage rates for their customers, at least for the first year or more.
Although the census has reported a sharp fall in building permits for single-family homes compared to a year ago, this trend has now reversed and more new homes are likely to become available in coming months.