
Market Statistics Report for
October 31, 2023
Market Dashboard
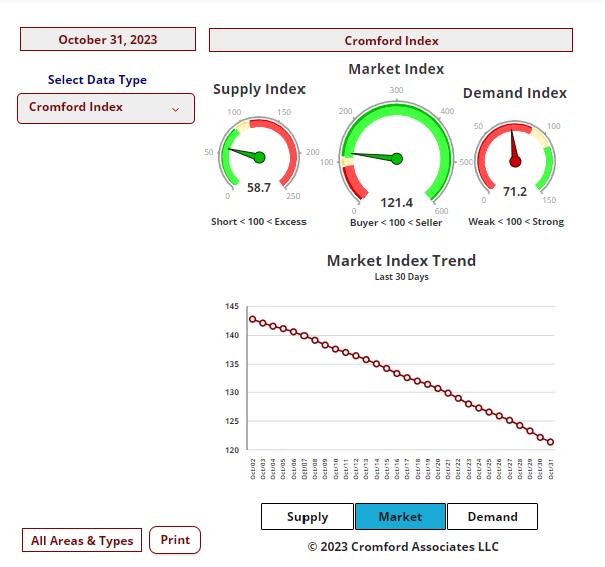
This Dashboard provides a comprehensive summary of the current state of the overall residential resale market.
All the statistics shown are for the entire Arizona Regional area as defined by ARMLS. All residential resale transactions recorded by ARMLS are included. Geographically, this includes Maricopa county, a large part of Pinal county and a small part of Yavapai county. In addition, "out of area" listings recorded on ARMLS are included, although these usually constitute a very small percentage of total sales and have very little effect on the data. All dwelling types are included. For-sale-by-owner, auctions and other non-MLS transactions are not included. Land, commercial units, and multiple dwelling units are also excluded.
Daily Market Snapshot – City Ranking
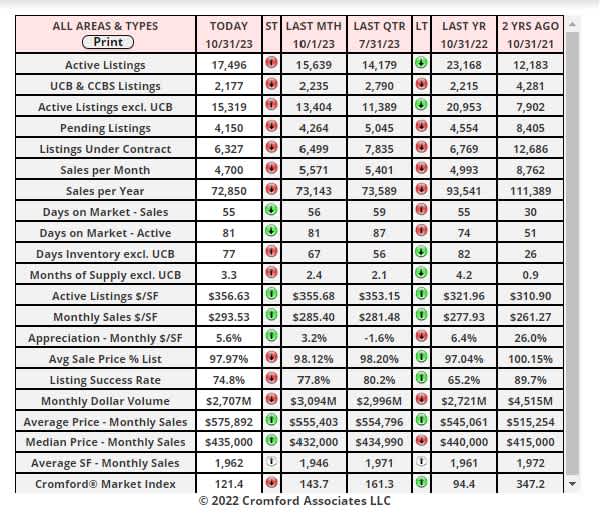
The table below provides a concise statistical summary of today's residential resale market in the Phoenix metropolitan area. The figures shown are for the entire Arizona Regional area as defined by ARMLS. All residential resale transactions recorded by ARMLS are included. Geographically, this includes Maricopa county, the majority of Pinal county and a small part of Yavapai county. In addition, "out of area" listings recorded in ARMLS are included, although these constitute a very small percentage (typically less than 1%) of total sales and have very little effect on the statistics.
Market Index
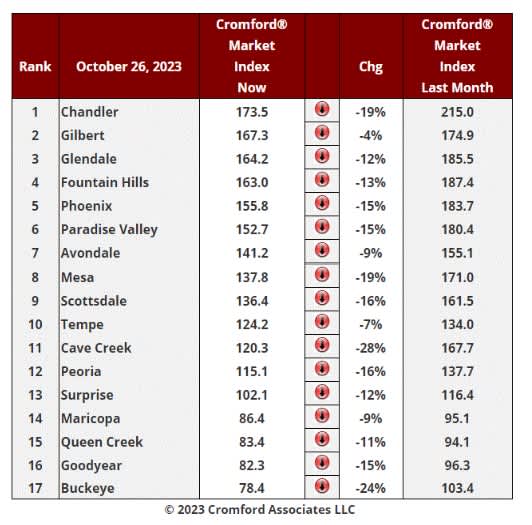
Oct 26 - Here is our latest table of Cromford® Market Index values for the single-family markets in the 17 largest cities.
Market Index Commentary:
The market is weakening at a faster rate, with an average decline of 14.5% in the Cromford® Market Index for the 17 cities above. This is worse than the 13.4% decline we saw last week.
Well above average declines in CMI can be seen in Cave Creek, Buckeye, Chandler and Mesa. Falling but at a lower speed are Gilbert, Avondale, Maricopa and Tempe.
12 out of 17 cities are still sellers markets with Surprise in the balanced zone while Buckeye, Goodyear, Queen Creek and Maricopa are all buyers' markets. Buckeye has even slipped below the 80 level.
Monthly Average Sales Price Per Square Foot:
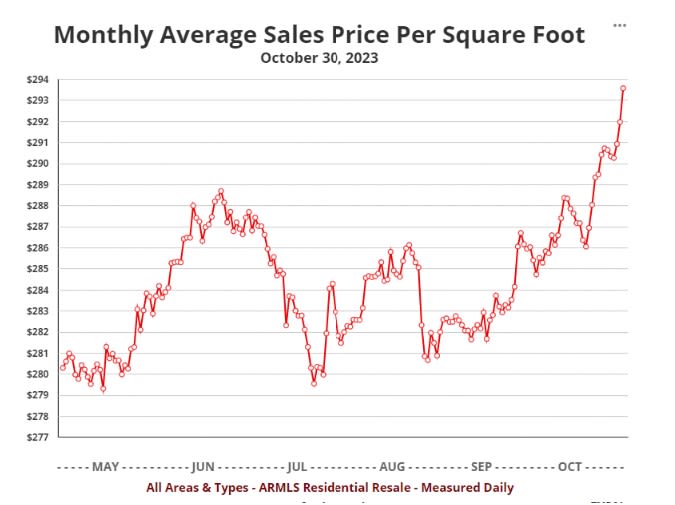
Oct 30 - Although the market is weakening quickly, you couldn't tell from the closed listing prices we are recording:
Breaking through the $293 level for the first time since July 12, 2022, this chart gives us the impression of a market in robust health.
This underlines the fact that sales pricing, even when measured every day, is very much a trailing indicator. Many of these prices were established in contracts agreed a few months ago when the Cromford® Market Index was still over 160, representing a strong seller's market with declining inventory. Sales volumes have also held up better in the luxury market than at the opposite end of the market, where first time buyers are having difficulty affording a mortgage. This bias towards the higher end pushes the average $/SF upwards.
The leading indicators, such as the CMI, contract ratio, days of inventory and listing success rate are all reflecting the recent step down in demand and the rapid rise in active listings.
This situation also shows us how poor the S&P / Case-Shiller® Home Price Index is in representing the current state of the market. Not only is the index a trailing indicator, it is 2 to 3 months behind the chart above because it uses a 3-month average for sales that closed between 2 and 5 months ago.
The latest S&P / Case-Shiller® Home Price Index® Numbers:
Oct 31 - The latest S&P / Case-Shiller® Home Price Index® numbers were published this Tuesday.The new report covers home sales during the period June to August 2023. This means the typical home sale closed in mid-July, more than 3 months ago.
We have 13 of the 20 cities showing rising prices for last month, with a higher index for Phoenix for the sixth month in a row. However, 7 cities declined slightly over the last month.
Comparing with the previous month's series we see the following changes:
1. Miami +1.21%
2. Las Vegas +1.10%
3. Detroit +0.81%
4. Charlotte +0.77%
5. Atlanta +.76%
6. Phoenix +0.67%
7. Boston +0.60%
8. San Diego +0.58%
9. New York +0.50%
10. Los Angeles +0.45%
11. Tampa +0.38%
12. Seattle +0.18%
13. Chicago +0.04%
14. Denver -0.06%
15. Washington -0.08%
16. Minneapolis -0.12%
17. Portland -0.12%
18. Dallas -0.18%
19. Cleveland -0.20%
20. San Francisco -0.47%
Phoenix has fallen from 2nd to 6th place since last month. The national average increase month to month was +0.43%, so Phoenix remains comfortably ahead of that standard.
Comparing year over year, we see the following changes:
1. Chicago +5.0%
2. New York +5.0%
3. Detroit +4.8%
4. San Diego +4.1%
5. Cleveland +3.9%
6. Atlanta +3.4%
7. Washington +3.4%
8. Miami +3.3%
9. Los Angeles +3.2%
10. Boston +3.1%
11. Charlotte +3.0%
12. Minneapolis +1.9%
13. Tampa +0.0%
14. Denver -0.6%
15. Portland -1.5%
16. Seattle -1.5%
17. Dallas -1.7%
18. San Francisco -2.5%
19. Phoenix -3.9%
20. Las Vegas -4.9%
2. New York +5.0%
3. Detroit +4.8%
4. San Diego +4.1%
5. Cleveland +3.9%
6. Atlanta +3.4%
7. Washington +3.4%
8. Miami +3.3%
9. Los Angeles +3.2%
10. Boston +3.1%
11. Charlotte +3.0%
12. Minneapolis +1.9%
13. Tampa +0.0%
14. Denver -0.6%
15. Portland -1.5%
16. Seattle -1.5%
17. Dallas -1.7%
18. San Francisco -2.5%
19. Phoenix -3.9%
20. Las Vegas -4.9%
Phoenix lies in 19th place, the same as last month and among the weakest cities on a year over year basis. 13 of the 20 cities are now showing positive price movement from one year ago and once again the northern cities are looking good on the year over year measure.
The national average is +2.6% year over year.
We can see that Phoenix pricing has been much weaker than the national average between 3Q 2022 and 3Q 2023.