
Market Statistics Report for
September 19, 2023
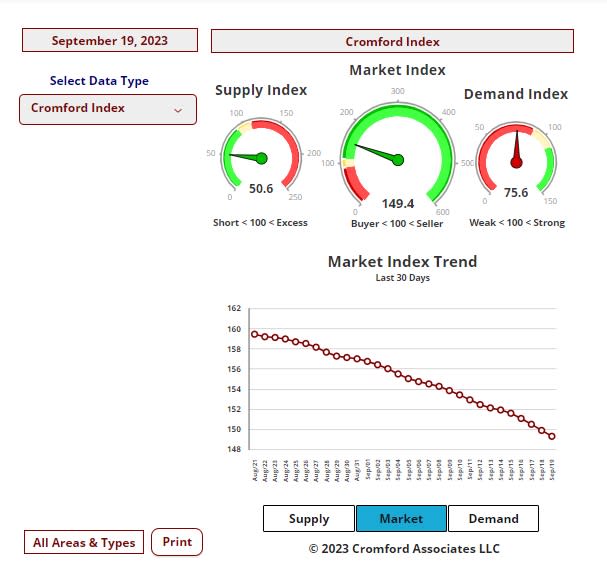
Market Dashboard
This Dashboard provides a comprehensive summary of the current state of the overall residential resale market.
All the statistics shown are for the entire Arizona Regional area as defined by ARMLS. All residential resale transactions recorded by ARMLS are included. Geographically, this includes Maricopa county, a large part of Pinal county and a small part of Yavapai county. In addition, "out of area" listings recorded on ARMLS are included, although these usually constitute a very small percentage of total sales and have very little effect on the data. All dwelling types are included. For-sale-by-owner, auctions and other non-MLS transactions are not included. Land, commercial units, and multiple dwelling units are also excluded.
Daily Market Snapshot – City Ranking
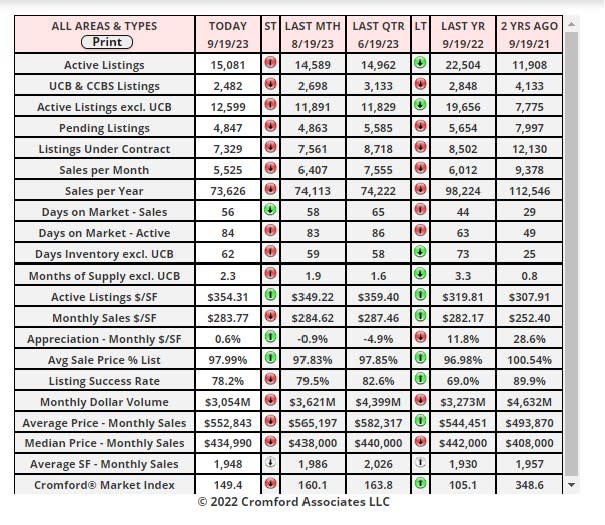
The table below provides a concise statistical summary of today's residential resale market in the Phoenix metropolitan area. The figures shown are for the entire Arizona Regional area as defined by ARMLS. All residential resale transactions recorded by ARMLS are included. Geographically, this includes Maricopa county, the majority of Pinal county and a small part of Yavapai county. In addition, "out of area" listings recorded in ARMLS are included, although these constitute a very small percentage (typically less than 1%) of total sales and have very little effect on the statistics.
Market Index
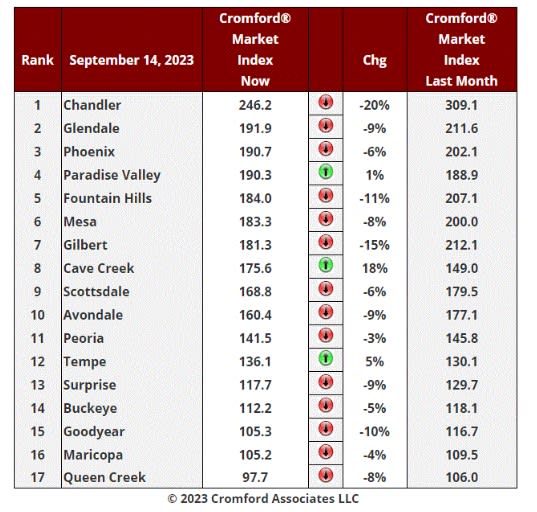
Sept 14 - Here is our latest table of Cromford® Market Index values for the single-family markets in the 17 largest cities.
News and Commentary – Average List Price Per Square Foot
Sep 18 - Over the last 2 months, the average price per sq. ft. for closed listings has been unusually stable. It started at $282.81 on July 18 and ended at $282.57 on September 18.
The average $/SF for the list price of those same closed listings is even more stable. It started at $288.33 and ended at $288.46. Note that this went up very slightly while the average sale price went
down very slightly, confirming that listings are closing for a marginally lower percentage of list than 2 months ago.
Meanwhile the average $/SF for listings under contract has been rising over the last month after falling for the month before that. It now stands at $313.72 after starting at $308.40 and dipping to $304.02.
This is a consequence of the luxury market waking up after its sleepy summer season.
The gap between the green line and the brown line in the chart is now too wide, suggesting that closed pricing will probably rise between now and October 18.