Market Statistics Report for
September 27, 2023
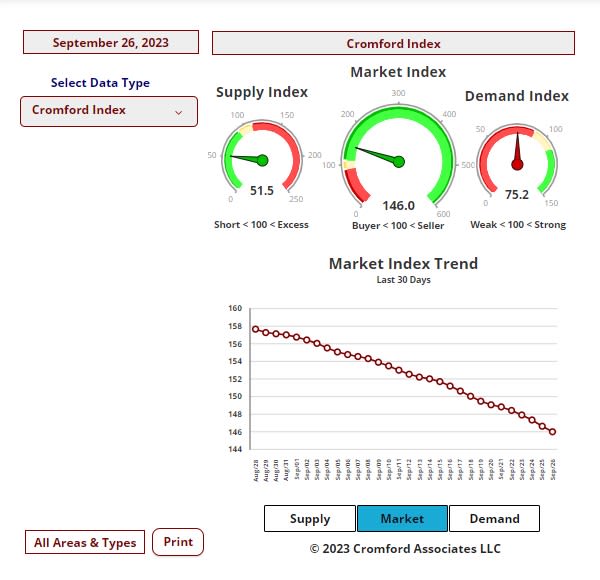
Market Dashboard
This Dashboard provides a comprehensive summary of the current state of the overall residential resale market.
All the statistics shown are for the entire Arizona Regional area as defined by ARMLS. All residential resale transactions recorded by ARMLS are included. Geographically, this includes Maricopa county, a large part of Pinal county and a small part of Yavapai county. In addition, "out of area" listings recorded on ARMLS are included, although these usually constitute a very small percentage of total sales and have very little effect on the data. All dwelling types are included. For-sale-by-owner, auctions and other non-MLS transactions are not included. Land, commercial units, and multiple dwelling units are also excluded.
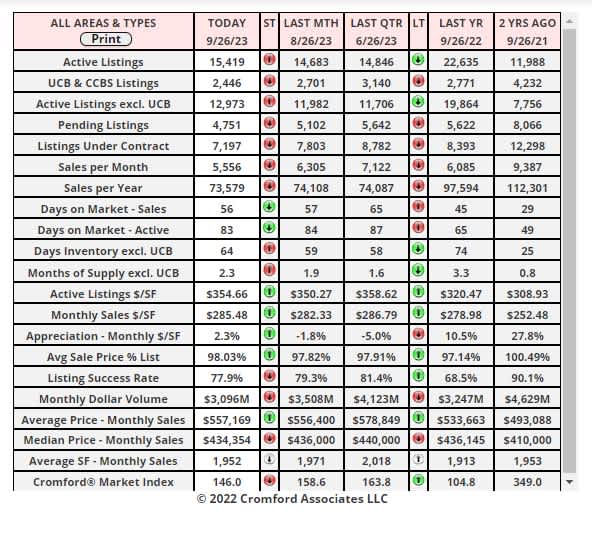
Daily Market Snapshot – City Ranking
The table below provides a concise statistical summary of today's residential resale market in the Phoenix metropolitan area. The figures shown are for the entire Arizona Regional area as defined by ARMLS. All residential resale transactions recorded by ARMLS are included. Geographically, this includes Maricopa county, the majority of Pinal county and a small part of Yavapai county. In addition, "out of area" listings recorded in ARMLS are included, although these constitute a very small percentage (typically less than 1%) of total sales and have very little effect on the statistics.
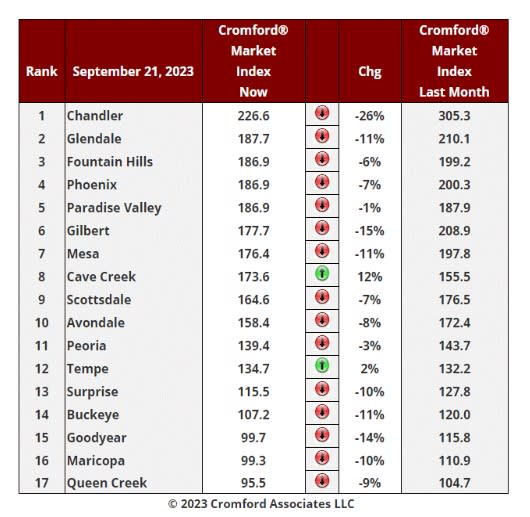
Market Index
Sept 21 - Here is our latest table of Cromford® Market Index values for the single-family markets in the 17 largest cities.
News and Commentary – Sep 26 – The latest S&P / Case-Shiller® Home Price Index® numbers were published this Tuesday.
The new report covers home sales during the period May to July 2023. This means the typical home sale closed in mid-June, more than 3 months ago.
We are now seeing all 20 cities showing rising prices for the last few months, with a higher index for Phoenix for the fifth month in a row.
Comparing with the previous month's series we see the following changes:
1. Las Vegas +1.12%
2. Phoenix +0.88%
3. Cleveland +0.85%
4. Chicago +0.84%
5. New York +0.81%
6. Charlotte +0.76%
7. Miami +0.74%
8. Tampa +0.74%
9. Detroit +0.74%
10. San Diego +0.73%
11. Atlanta +0.70%
12. Los Angeles +0.62%
13. Washington +0.57%
14. Seattle +0.46%
15. Dallas +0.30%
16. Minneapolis +0.21%
17. Denver +0.18%
18. Boston +0.14%
19. San Francisco +0.14%
20. Portland -0.15%
2. Phoenix +0.88%
3. Cleveland +0.85%
4. Chicago +0.84%
5. New York +0.81%
6. Charlotte +0.76%
7. Miami +0.74%
8. Tampa +0.74%
9. Detroit +0.74%
10. San Diego +0.73%
11. Atlanta +0.70%
12. Los Angeles +0.62%
13. Washington +0.57%
14. Seattle +0.46%
15. Dallas +0.30%
16. Minneapolis +0.21%
17. Denver +0.18%
18. Boston +0.14%
19. San Francisco +0.14%
20. Portland -0.15%
Phoenix has risen very strongly in this table over the last 3 months, from last place In June to 16th place in July, 7th place in August and 2nd place in September. The national average increase month to month was +0.60%, so Phoenix was also comfortably ahead of that standard.
19 of the 20 cities are showing positive price appreciation month to month though the rates of appreciation are much lower than last month in the majority of them.
Comparing year over year, we see the following changes:
1. Chicago +4.4%
2. Cleveland +4.0%
3. New York +3.8%
4. Detroit +3.2%
5. Atlanta +2.2%
6. Washington +1.9%
7. Miami +1.9%
8. Charlotte +1.8%
9. Boston +1.3%
10. Minneapolis +1.0%
11. San Diego +0.7%
12. Los Angeles +0.4%
13. Tampa -0.8%
14. Denver -2.8%
15. Portland -3.3%
16. Dallas -3.4%
17. Seattle -5.5%
18. San Francisco -6.2%
19. Phoenix -6.6%
20. Las Vegas -7.2%
2. Cleveland +4.0%
3. New York +3.8%
4. Detroit +3.2%
5. Atlanta +2.2%
6. Washington +1.9%
7. Miami +1.9%
8. Charlotte +1.8%
9. Boston +1.3%
10. Minneapolis +1.0%
11. San Diego +0.7%
12. Los Angeles +0.4%
13. Tampa -0.8%
14. Denver -2.8%
15. Portland -3.3%
16. Dallas -3.4%
17. Seattle -5.5%
18. San Francisco -6.2%
19. Phoenix -6.6%
20. Las Vegas -7.2%
Phoenix lies in 19th place, down from 17th last month and among the weakest cities on a year over year basis. More than half the cities are now showing positive price movement from one year ago and once again the northern cities are looking good on the year over year measure.
The national average is +1.0% year over year.
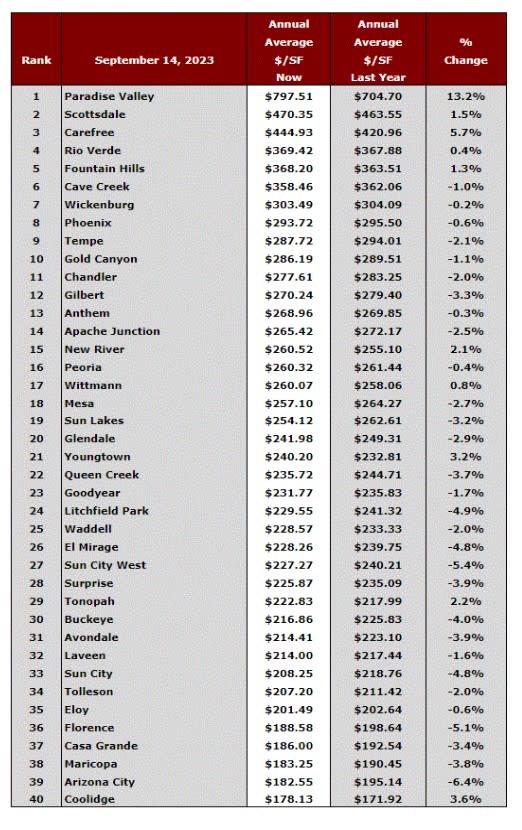
News and Commentary – Annual Average Sales Price Per Square Foot
This table ranks the cities by their annual average sales price per square foot. Only single-family detached homes are included in these numbers. Information for the large and secondary cities is current as of the date shown. Data for the 11 small cities is updated on a monthly basis and is measured on the 13th of each month.
The primary function of this table is to show the least and most affordable areas in the Phoenix metropolitan area together with longer term pricing trends.
Annual averages are based on a relatively large number of sales. Therefore, they are not as subject to rapid change as monthly averages. The downside is that they do not necessarily represent the current market very accurately, since they include sales from up to a year ago. Pricing may have moved a great deal since then; yet there is still some useful information.
Note that Higley has been included in Gilbert and Ahwatukee and Desert Hills are included in Phoenix.