
Market Statistics Report for September 7, 2024
Market Dashboard – Dashboard
This Dashboard provides a comprehensive summary of the current state of the overall residential resale market.
All the statistics shown are for the entire Arizona Regional area as defined by ARMLS. All residential resale transactions
recorded by ARMLS are included. Geographically, this includes Maricopa County, a large part of Pinal county and a small
part of Yavapai county. In addition, "out of area" listings recorded on ARMLS are included, although these usually
constitute a very small percentage of total sales and have very little effect on the data.
part of Yavapai county. In addition, "out of area" listings recorded on ARMLS are included, although these usually
constitute a very small percentage of total sales and have very little effect on the data.
All dwelling types are included. For-sale-by-owner, auctions and other non-MLS transactions are not included. Land,
commercial units, and multiple dwelling units are also excluded.
commercial units, and multiple dwelling units are also excluded.
Daily Market Snapshot
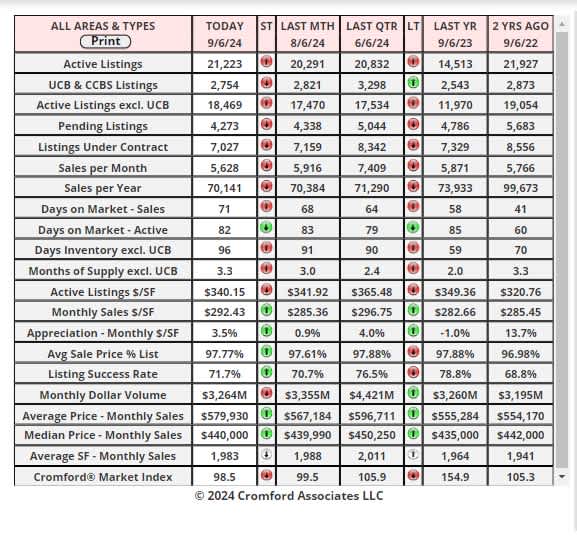
The table below provides a concise statistical summary of today's residential resale market in the Phoenix metropolitan
area. The figures shown are for the entire Arizona Regional area as defined by ARMLS. All residential resale transactions
recorded by ARMLS are included. Geographically, this includes Maricopa county, the majority of Pinal county and a small
part of Yavapai county. In addition, "out of area" listings recorded in ARMLS are included, although these constitute a very
small percentage (typically less than 1%) of total sales and have very little effect on the statistics.
area. The figures shown are for the entire Arizona Regional area as defined by ARMLS. All residential resale transactions
recorded by ARMLS are included. Geographically, this includes Maricopa county, the majority of Pinal county and a small
part of Yavapai county. In addition, "out of area" listings recorded in ARMLS are included, although these constitute a very
small percentage (typically less than 1%) of total sales and have very little effect on the statistics.
Cromford Market Index
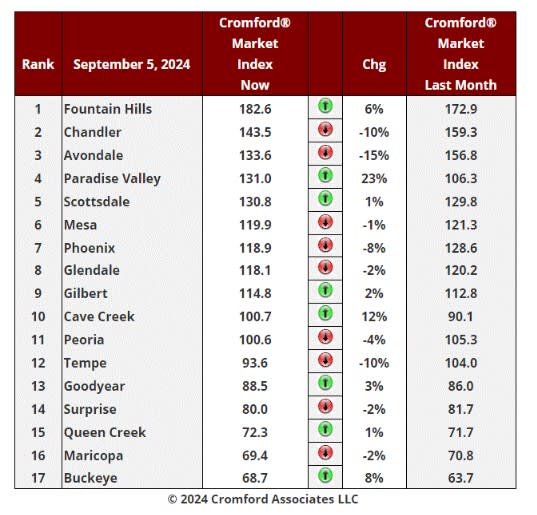
Sept 5 - Here is our latest table of Cromford® Market Index values for the single-family markets in the 17 largest
cities.
cities.
Cromford Market Index Commentary
The trend has reversed, and things are deteriorating again for sellers, albeit only gently.
There are 8 cities showing an increase in their Cromford® Market Index over the past month. But we also have 9
cities showing a decrease and that includes the two largest cities - Phoenix and Mesa.
cities showing a decrease and that includes the two largest cities - Phoenix and Mesa.
The average change in CMI over the past month is +0.1%. Last week we saw +1.2%.
Cave Creek, Paradise Valley and Buckeye are showing the largest percentage gains. In addition, Scottsdale,
Fountain Hills, Gilbert, Queen Creek and Goodyear all up over the last month. The largest declines are no longer
concentrated across the whole of the Southeast Valley, though Tempe and Chandler are still down 10%. Phoenix
and Avondale have weakened substantially.
Fountain Hills, Gilbert, Queen Creek and Goodyear all up over the last month. The largest declines are no longer
concentrated across the whole of the Southeast Valley, though Tempe and Chandler are still down 10%. Phoenix
and Avondale have weakened substantially.
9 out of 17 cities remain seller's markets over 110, though 4 of these are below 120. We have 3 cities that are
balanced, while the remaining 5 are buyer's markets. 2 cities still remain over 140 while 3 remain under 75.
balanced, while the remaining 5 are buyer's markets. 2 cities still remain over 140 while 3 remain under 75.
Paradise Valley is up sharply but it is a very different market from the other 16. Fountain Hills has opened up a
large lead at the top of the table. At the other end, Maricopa is threatened by Buckeye where the market has
improved over the last four weeks.
large lead at the top of the table. At the other end, Maricopa is threatened by Buckeye where the market has
improved over the last four weeks.
Outside the single-family market and in the smaller cities, demand remains poor while supply is growing and the
Cromford® Market Index for the whole market has slipped below 99.
Cromford® Market Index for the whole market has slipped below 99.
Supply of Active Listings Commentary
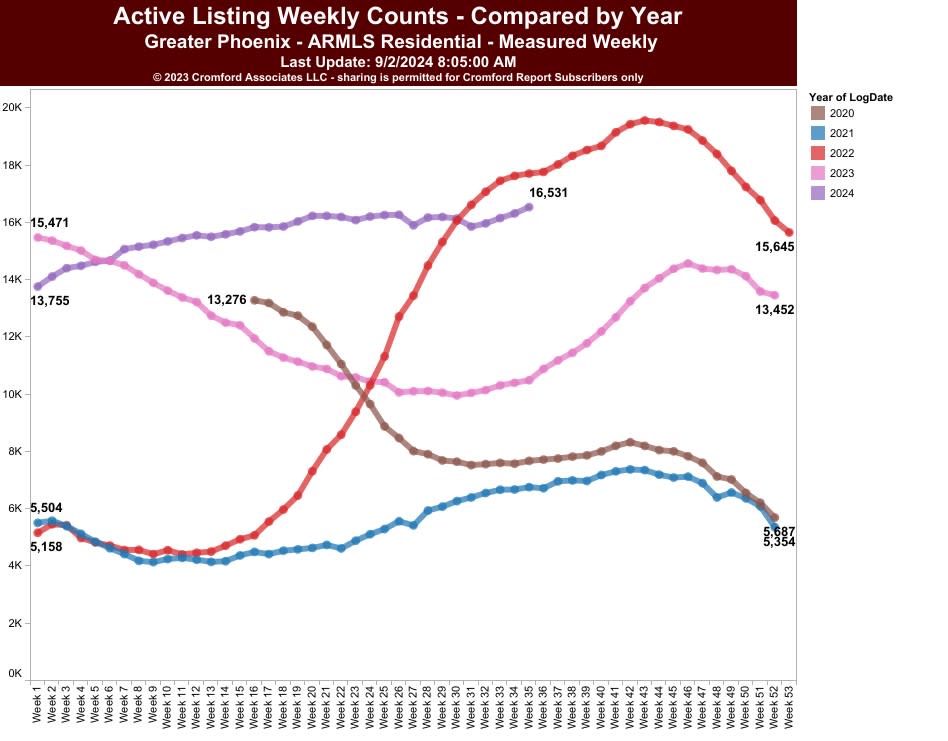
Sep 2 - The supply of active listings without a contract turned around in August and we now have 5.5% more supply
than we had available at the beginning of August. We are also up 57% compared with September 1, 2023. The
short-term increase is not huge, but it is intriguing as we rarely see this in August. It is usually September when
supply starts to rise.
You might imagine that the decline in mortgage interest rates over the last month would have increased demand
and reduced supply, but the housing market often responds unexpectedly to interest rates and compared with a
month ago, demand is down slightly while supply is up. It is not up across the board, however. In the single-family
detached luxury sector above $3 million, we have 4% fewer listings active than a month ago (though 20% more
than a year ago). There is one particular segment where supply has increased by almost 18% during August -
single family detached homes priced between $300K and $350K. This sticks out like a sore thumb with more than
double the increase of any other price segment. I had to dive in to find out more.
than we had available at the beginning of August. We are also up 57% compared with September 1, 2023. The
short-term increase is not huge, but it is intriguing as we rarely see this in August. It is usually September when
supply starts to rise.
You might imagine that the decline in mortgage interest rates over the last month would have increased demand
and reduced supply, but the housing market often responds unexpectedly to interest rates and compared with a
month ago, demand is down slightly while supply is up. It is not up across the board, however. In the single-family
detached luxury sector above $3 million, we have 4% fewer listings active than a month ago (though 20% more
than a year ago). There is one particular segment where supply has increased by almost 18% during August -
single family detached homes priced between $300K and $350K. This sticks out like a sore thumb with more than
double the increase of any other price segment. I had to dive in to find out more.
If we home in on the geography, we find the biggest increase in Maricopa rather than Pinal, which rules out new
homes being the culprit. The areas that have grown supply the most during August are Glendale and West Phoenix.
homes being the culprit. The areas that have grown supply the most during August are Glendale and West Phoenix.
In fact almost all of the increase happened over just 11 days between August 15 and August 26 and was
concentrated in the least expensive ZIP codes of the inner West Valley. These homes tend to be older than average
with many built in the 1950s or 1960s. There is no sign of increased distress causing the surge in listings. Active
single-family listings in this specific area are up 32% across all price ranges and even more between $300K and
$350K.
concentrated in the least expensive ZIP codes of the inner West Valley. These homes tend to be older than average
with many built in the 1950s or 1960s. There is no sign of increased distress causing the surge in listings. Active
single-family listings in this specific area are up 32% across all price ranges and even more between $300K and
$350K.
Something is going on in the Inner West Valley. I wonder if this supply boost is caused by sellers listing their homes
because they want to upgrade to larger and newer properties once interest rates come down further. They probably
feel the need to have a buyer in hand before making an offer on the home they want.
because they want to upgrade to larger and newer properties once interest rates come down further. They probably
feel the need to have a buyer in hand before making an offer on the home they want.
Other theories are available.
Market Summary for the Beginning of September
Here are the basics - the ARMLS numbers for September 1, 2024, compared with September 1, 2023 for all areas
& types:
& types:
• Active Listings (excluding UCB & CCBS): 18,430 versus 11,969 last year - up 54% - and up 5.5% from 17,474
last month
• Active Listings (including UCB & CCBS): 21,047 versus 14,476 last year - up 45% - and up 3.6% compared
with 20,320 last month
• Pending Listings: 4,041 versus 4,604 last year - down 12.2% - and down 9.0% from 4,441 last month
• Under Contract Listings (including Pending, CCBS & UCB): 6,658 versus 7,111 last year - down 6.4% - and
down 8.6% from 7,287 last month
• Monthly Sales: 5,683 versus 6,267 last year - down 9.3% - and down 8.5% from 6,208 last month
• Monthly Average Sales Price per Sq. Ft.: $290.60 versus $282.14 last year - up 3.0% - and up 1.3% from
$286.74 last month
• Monthly Median Sales Price: $440,000 versus $435,000 last year - up 1.1% - but unchanged from $440,000
last month
last month
• Active Listings (including UCB & CCBS): 21,047 versus 14,476 last year - up 45% - and up 3.6% compared
with 20,320 last month
• Pending Listings: 4,041 versus 4,604 last year - down 12.2% - and down 9.0% from 4,441 last month
• Under Contract Listings (including Pending, CCBS & UCB): 6,658 versus 7,111 last year - down 6.4% - and
down 8.6% from 7,287 last month
• Monthly Sales: 5,683 versus 6,267 last year - down 9.3% - and down 8.5% from 6,208 last month
• Monthly Average Sales Price per Sq. Ft.: $290.60 versus $282.14 last year - up 3.0% - and up 1.3% from
$286.74 last month
• Monthly Median Sales Price: $440,000 versus $435,000 last year - up 1.1% - but unchanged from $440,000
last month
The re-sale market continues in the doldrums and has reacted very little so far to the lower mortgage rates that
have emerged since July. Under contract listings went down a further 8.6% during August rather than staging a
recovery. Demand appears to be stronger in the new home sector but that has a relatively modest effect on the
MLS statistics because the bulk of new homes are not listed on the MLS. However, one look at the stock price
charts for the major homebuilders will tell you they are in a good mood.
have emerged since July. Under contract listings went down a further 8.6% during August rather than staging a
recovery. Demand appears to be stronger in the new home sector but that has a relatively modest effect on the
MLS statistics because the bulk of new homes are not listed on the MLS. However, one look at the stock price
charts for the major homebuilders will tell you they are in a good mood.
Re-sale supply usually rises between August and November, but this year the trend got off to an early start and we
have 5.5% more listings active and without a contract than a month ago. With demand weak and supply rising,
sellers are not getting the break they were probably hoping for. Concessions to buyers and price cuts continue to
be common and widespread.
have 5.5% more listings active and without a contract than a month ago. With demand weak and supply rising,
sellers are not getting the break they were probably hoping for. Concessions to buyers and price cuts continue to
be common and widespread.
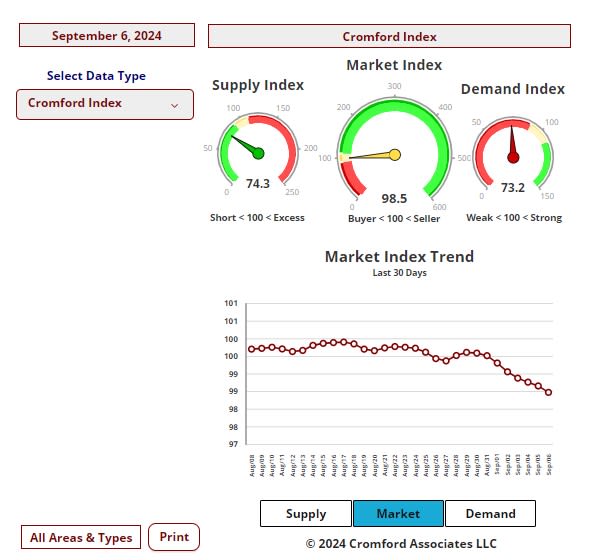
The Cromford® Market Index slipped below 100 at the end of July and spent all of August hovering between 99
and 100. We rarely see such little movement in the CMI. The contract ratio is somewhat less stable, falling from 42
to 36 and this represents a further cooling in the market. It seems many potential buyers want to see rates drop
below 6% before they make a move.
and 100. We rarely see such little movement in the CMI. The contract ratio is somewhat less stable, falling from 42
to 36 and this represents a further cooling in the market. It seems many potential buyers want to see rates drop
below 6% before they make a move.
The only bright spot for sellers is that pricing improved during August with the average $/SF rising 1.3% from July.
However, the median sales price was unchanged and is up only 1.1% from a year ago. This is less than inflation
so in real terms homes are cheaper than this time last year. This statement does not apply to the very top end of
the market which has significantly risen in price over the last 12 months. In fact, we saw a new record of almost
$32.4 million paid for a new home just completed in Paradise Valley's Mummy Mountain Estates. Unusually, this
was a spec home, and it sold for more than $2,000 per sq. ft. The market over $5 million is not seeing the same
conditions as the regular market.
However, the median sales price was unchanged and is up only 1.1% from a year ago. This is less than inflation
so in real terms homes are cheaper than this time last year. This statement does not apply to the very top end of
the market which has significantly risen in price over the last 12 months. In fact, we saw a new record of almost
$32.4 million paid for a new home just completed in Paradise Valley's Mummy Mountain Estates. Unusually, this
was a spec home, and it sold for more than $2,000 per sq. ft. The market over $5 million is not seeing the same
conditions as the regular market.
It would take a resurgence in demand to pump more life back into this dormant regular market and so far, it seems
that the Federal Reserve has not done enough by suggesting they are in favor of dropping the base rate. The
question now is whether actually dropping the rate in September is going to be an event or a snooze for home
buyers.
that the Federal Reserve has not done enough by suggesting they are in favor of dropping the base rate. The
question now is whether actually dropping the rate in September is going to be an event or a snooze for home
buyers.
As usual we will have to wait and see. Look to the under contract count to be the first thing to show any pick-up in
demand.
demand.