
Market Statistics Report for April 11, 2025
Market Dashboard – Dashboard
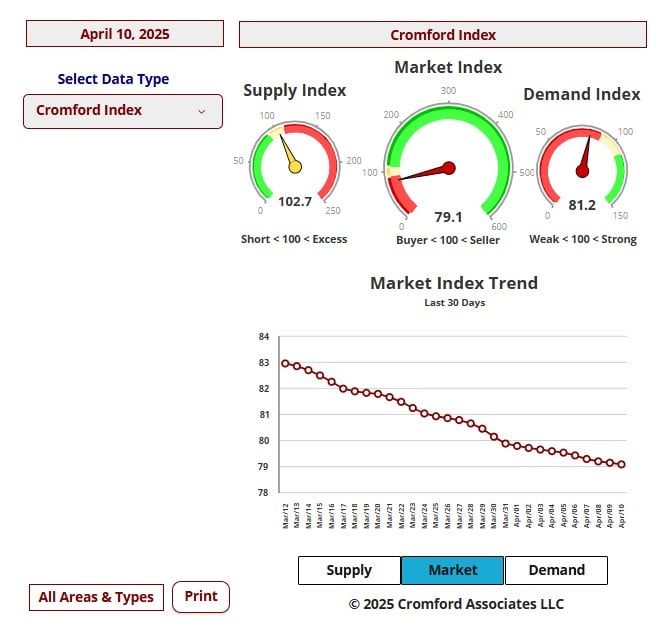
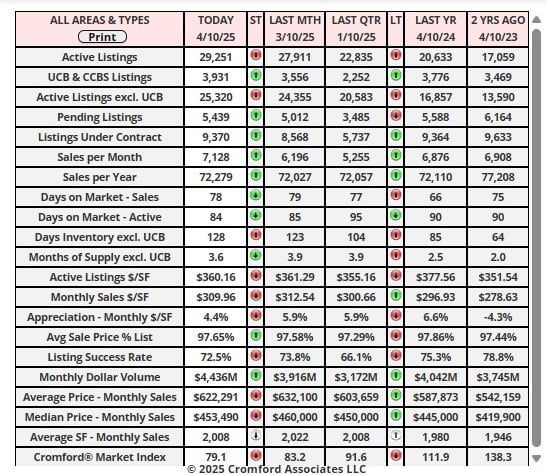
This Dashboard provides a comprehensive summary of the current state of the overall residential resale market.
All the statistics shown are for the entire Arizona Regional area as defined by ARMLS. All residential resale transactions
recorded by ARMLS are included. Geographically, this includes Maricopa County, a large part of Pinal County and a small
part of Yavapai county. In addition, "out of area" listings recorded on ARMLS are included, although these usually
constitute a very small percentage of total sales and have very little effect on the data.
All dwelling types are included. For-sale-by-owner, auctions and other non-MLS transactions are not included. Land,
commercial units, and multiple dwelling units are also excluded.
commercial units, and multiple dwelling units are also excluded.
City Ranking – Snapshot
This table ranks the cities by their annual average sales price per square foot. Only single family detached homes are
included in these numbers. Information for the large and secondary cities is current as of the date shown. Data for the
11 small cities is updated on a monthly basis, and is measured on the 13th of each month.The primary function of this
table is to show the least and most affordable areas in the Phoenix metropolitan area together with longer term pricing
trends.Annual averages are based on a relatively large number of sales. Therefore they are not as subject to rapid
change as monthly averages. The downside is that they do not necessarily represent the current market very
accurately, since they include sales from up to a year ago. Pricing may have moved a great deal since then.
Cromford Market Index
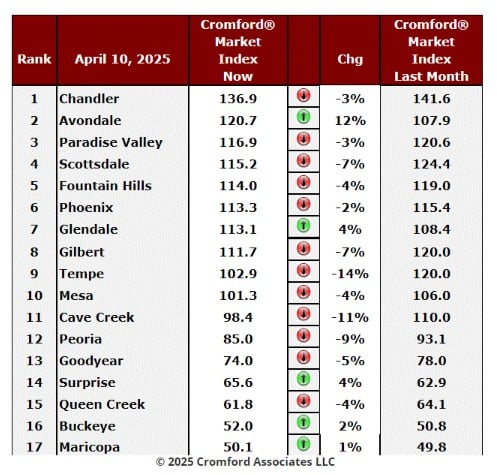
April 10 - Here is our latest table of Cromford® Market Index values for the single-family markets in the 17 largest
cities.
cities.
Cromford Market Index Commentary
The table is still showing a swing in favor of buyers. We have 12 cities that have deteriorated for sellers over the
last month and 5 that have improved. Avondale is the only city with a high percentage improvement of 12%, while
Glendale and Surprise managed 4%. At the bottom of the table, Buckeye and Maricopa gave sellers a modest gain
of 2% and 1% respectively, but they remain strongly favorable to buyers.
last month and 5 that have improved. Avondale is the only city with a high percentage improvement of 12%, while
Glendale and Surprise managed 4%. At the bottom of the table, Buckeye and Maricopa gave sellers a modest gain
of 2% and 1% respectively, but they remain strongly favorable to buyers.
All the other cities moved in favor of buyers, with Tempe, Cave Creek and Peoria the leaders in that movement.
The average change in CMI over the past month is -2.9% while last week we saw -3.0%. This stops the accelerating
trend that started 3 weeks ago but represents a stall at the status quo.
trend that started 3 weeks ago but represents a stall at the status quo.
We have 8 cities that are still seller's markets, 3 that are balanced and 6 that are buyer's markets. Two cities
(Chandler and Avondale) are above 120, but the other 6 seller's markets are only in that category by a small margin
with CMIs less than 117.
(Chandler and Avondale) are above 120, but the other 6 seller's markets are only in that category by a small margin
with CMIs less than 117.
Unusual weakness and turmoil in the Treasury bill market has raised the level of risk among mortgage lenders.
Mortgage rates have moved higher as a result and the typical 30-year fixed rate is now just under 7%. In the current
environment we do not expect demand to improve significantly. Supply is still increasing, which is unusual for April
and therefore another negative signal. Unlike the stock and bonds markets, movement in the housing market is
slow and steady but unfortunately for sellers the movement is slow and steady in the wrong direction. Pricing finally
shows signs of weakening for the bulk of the market. As we move into the warmest months, we anticipate pricing
charts moving lower, particularly during the third quarter.
Apr 8 - For a couple of days last week, it appeared that turmoil in the stock market was making treasury bonds
more attractive as a safe haven and therefore starting a favorable trend for mortgage rates. The 30-year fixed rate
dropped as low as 6.60% last Friday. But this came to a sudden sticky end this week.
The treasury auction held this week met much softer than expected demand and the price of US treasury bonds
fell sharply. This caused yields to spike higher and mortgage rates responded immediately by moving back up. The
30-year T-bill yield has risen from 4.45% to 4.85% and briefly exceeded 5% at one point. This volatility has not
been seen since 1982 when yields were at 14%. Bond traders are very nervous.
As a result mortgage rates are now up to the levels we saw in February - 6.85% is typical for a 30-year fixed loan.
Unfortunately, this is not conducive to the recovery in demand we have been hoping for in the housing market.
The problem is that foreign demand for US bonds is correlated to the volume of imports to the USA. It seems likely
that in the face of 104% tariffs, imports from China will fall sharply, meaning demand for treasury bonds will be
lower too. The bond market is bracing for more pain in the coming weeks because of this reduced demand. This is
likely to push mortgage rates higher, irrespective of what happens to inflation. However, nothing is certain as the
main characteristic of all our markets at the moment is an extreme lack of predictability and high levels of uncertainty.
Foreclosures Pending
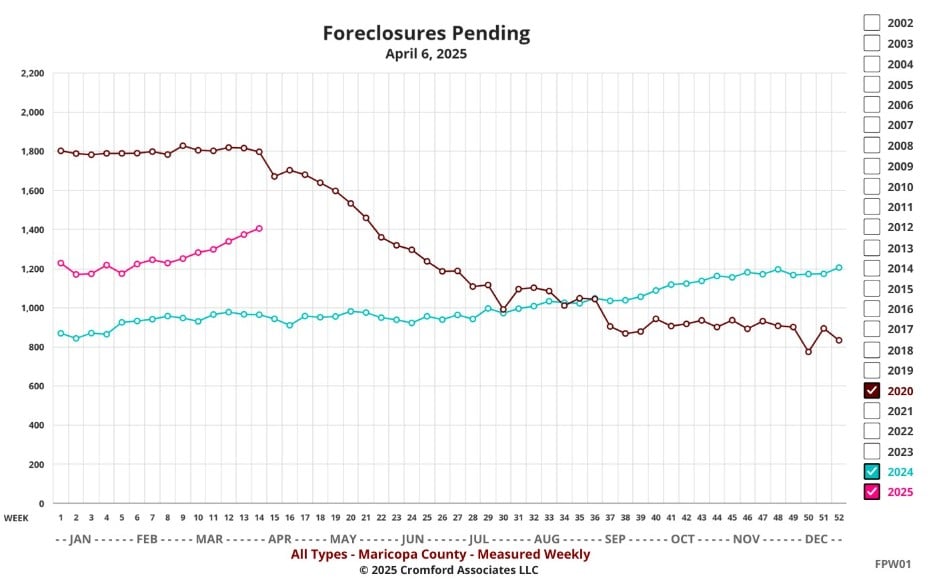
Apr 7 - Foreclosures are rising, although they remain a long way below "normal" at the moment. The chart below
shows the number of pending foreclosures in Maricopa County, measured weekly and comparing 2025 with 2024
and 2020, the year when COVID struck and lenders introduced measures to slow or prevent foreclosure actions.
shows the number of pending foreclosures in Maricopa County, measured weekly and comparing 2025 with 2024
and 2020, the year when COVID struck and lenders introduced measures to slow or prevent foreclosure actions.
A pending foreclosure means a a Notice of Trustee Sale (NOTS) has been filed, and it is still outstanding. A NOTS
can be closed by an auction taking place (Trustee Sale) creating a Trustee Deed (TD), or it may be cancelled if the
borrower makes good on the debts, either by catching up with their mortgage payments or by selling the house and
using the proceeds to repay the mortgage either in full or with an agreed short sale.
As you can see we currently have just over 1,400 pending foreclosures in Maricopa County, up almost 50% from
this week last year. While this is not a problem in itself, the trend is concerning and if the count continues to rise at
this pace for several months it would start to get more ominous.
this week last year. While this is not a problem in itself, the trend is concerning and if the count continues to rise at
this pace for several months it would start to get more ominous.
Canadian Homeowners Verbi
Apr 6 – It’s been questioned whether it was true that more Canadian homeowners are selling up in Arizona and
returning to Canada.
returning to Canada.
It is not possible to determine for sure the nationality of any homeowner since this is not recorded in any public
document and there are no restrictions based on nationality. Also, some people hold multiple nationalities. In
addition, Canadians may hold legal Permanent Resident status in the USA and may no longer have a home in
Canada.
document and there are no restrictions based on nationality. Also, some people hold multiple nationalities. In
addition, Canadians may hold legal Permanent Resident status in the USA and may no longer have a home in
Canada.
However, the Affidavit of Value, filed when the deed is recorded by the county, does include a section for tax mailing
address, and there has always been a percentage of buyers completing a Canadian address in the section. This is
no doubt only a subset of Canadian owners, as not all of them will provide their Canadian address and some will
use the property address to receive their tax bill. However, it serves as a useful guide when we are trying to detect
trends.
Here are the current ownership numbers for Maricopa and Pinal counties:
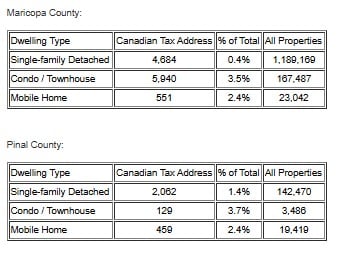
We can see that Canadians prefer Condo / Townhouse properties. Their share of the market for these is similar in
Maricopa and Pinal (3.5 to 3.7%), and their share of mobile homes is also similar (2.4%). However, if they have
more than 3 times the percentage share of single-family detached homes in Pinal compared to Maricopa.
Maricopa and Pinal (3.5 to 3.7%), and their share of mobile homes is also similar (2.4%). However, if they have
more than 3 times the percentage share of single-family detached homes in Pinal compared to Maricopa.
Overall, 0.9% of single-unit residential properties have Canadian tax mailing addresses, and this rises to 1.6% in
Pinal and falls to 0.8% in Maricopa.
Pinal and falls to 0.8% in Maricopa.
Now let us take a look at active listings for the above homes and how they have changed over the last year.
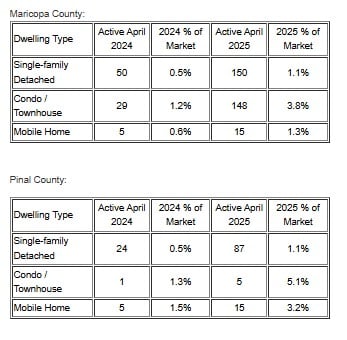
Overall active listings for homes with Canadian tax addresses have grown from 114 to 420, an increase of 268%.
This is a much higher increase than the 48% growth we have seen in active listings for the market overall.
We can conclude that yes - Canadians are more likely to be selling their homes in April 2025 than they were in
April 2024. Roughly 3 times more likely. We cannot tell their motives nor where they are moving to. We can see
that condo / townhouse owners are most likely to be selling. We can also see that the Canadian dollar is relatively
weak versus the US dollar, which tends to encourage selling property in the USA rather than buying.
These numbers still leave a majority of Canadian property owners who are not listing their homes for sale.
We can also see that Canadians do not make up a large percentage of any market segment, so their purchases
and sales are do not have a strong influence on the overall market.
and sales are do not have a strong influence on the overall market.
We also find that some people with Canadian tax addresses are purchasing homes in Central Arizona - 71 to be
precise in Maricopa County during the first quarter of 2025. This is down from 86 this time last year, but the flow of
Canadians is certainly not all one-way.
precise in Maricopa County during the first quarter of 2025. This is down from 86 this time last year, but the flow of
Canadians is certainly not all one-way.