
Market Statistics Report for April 18, 2025
Market Dashboard – Dashboard
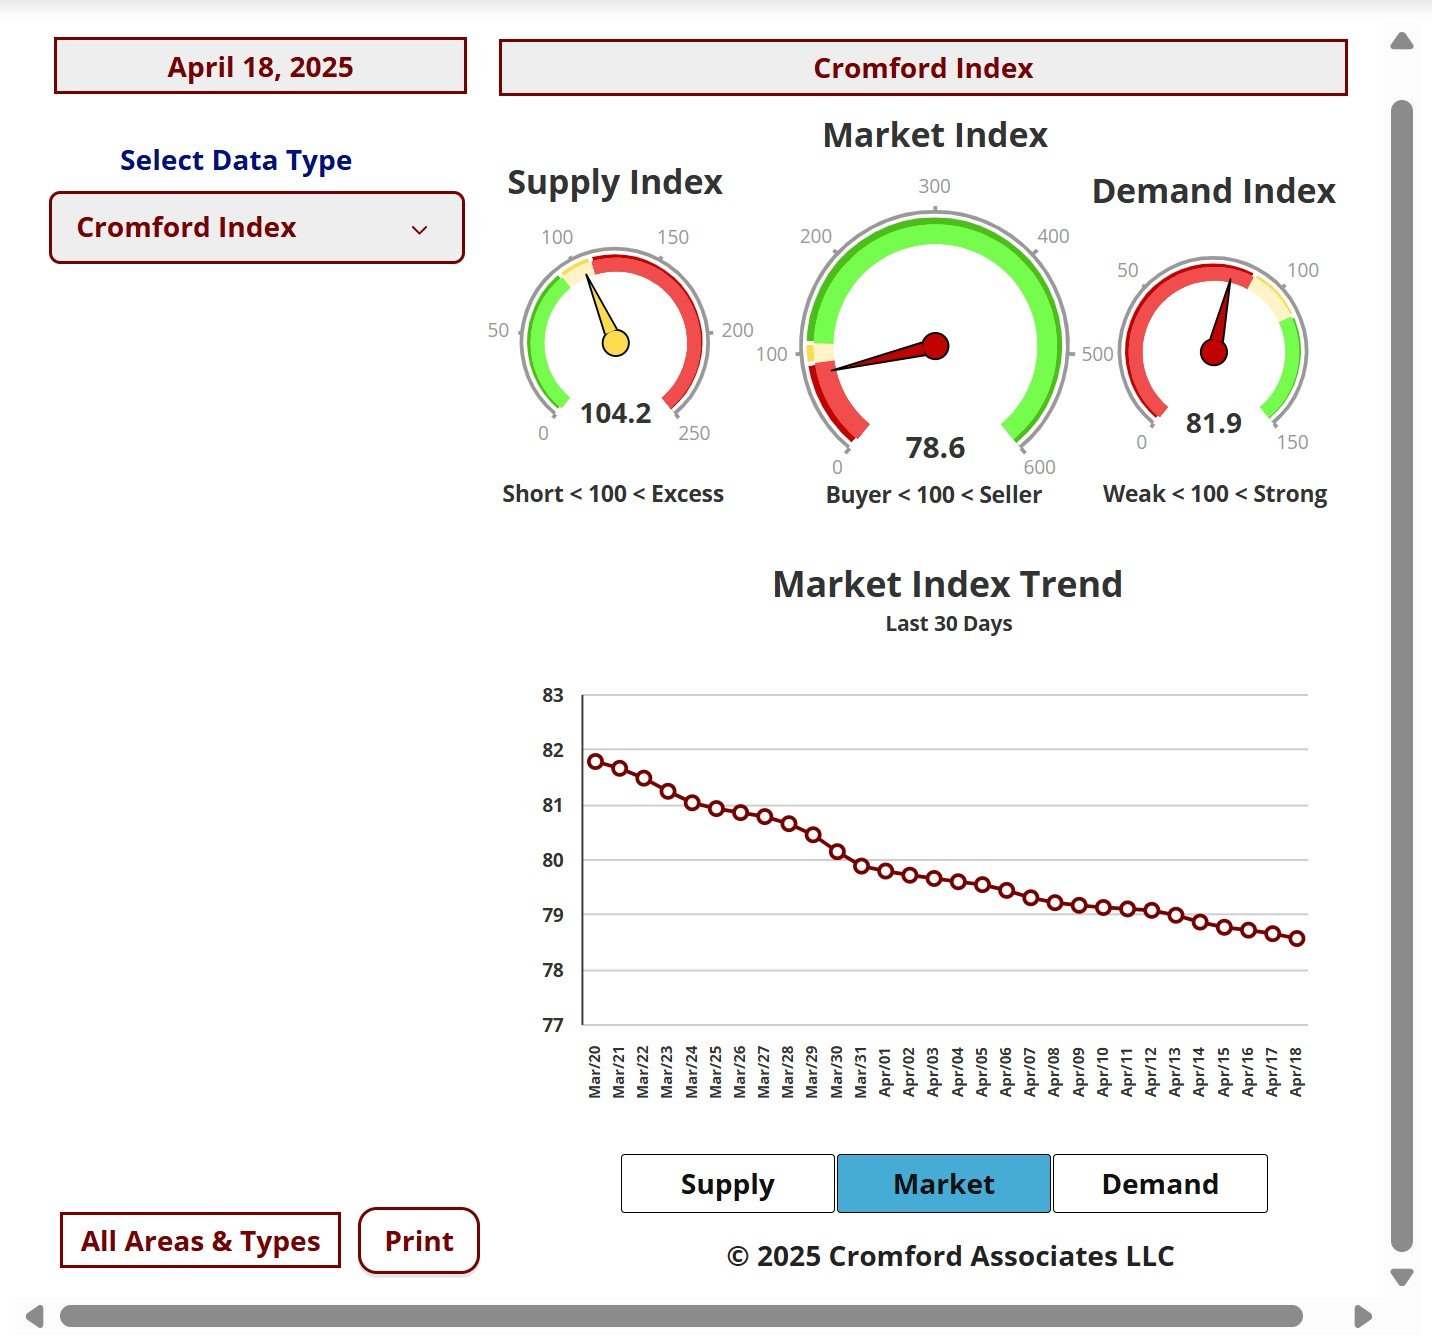
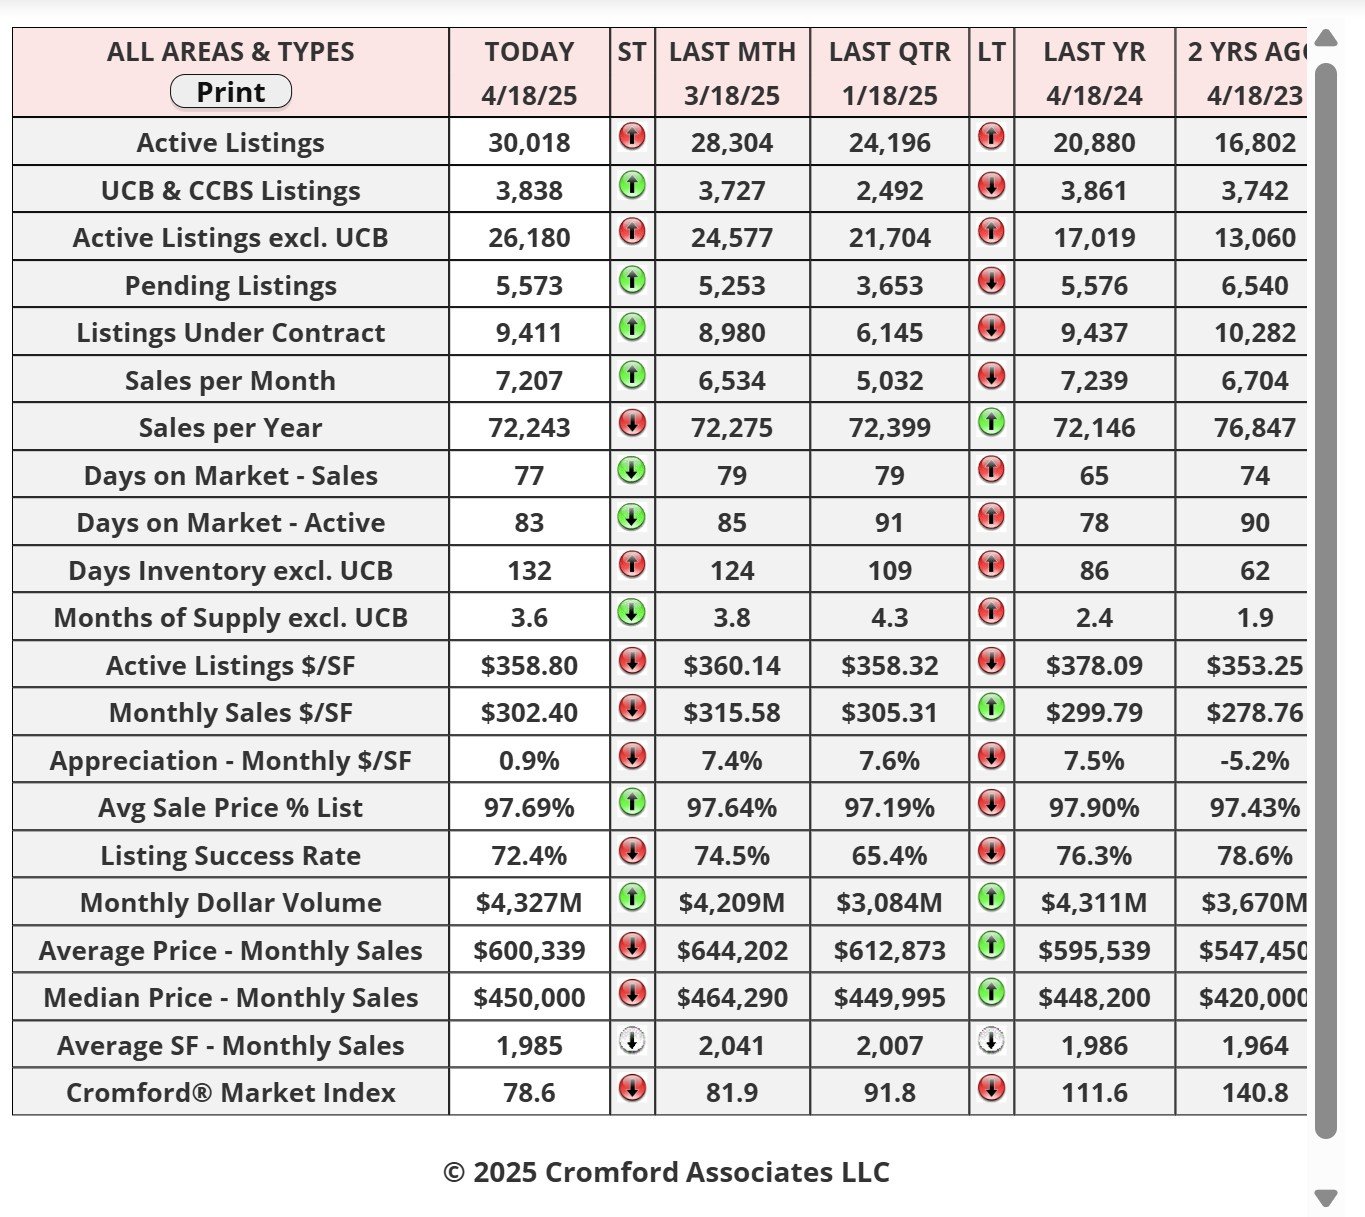
This Dashboard provides a comprehensive summary of the current state of the overall residential resale market.
All the statistics shown are for the entire Arizona Regional area as defined by ARMLS. All residential resale transactions
recorded by ARMLS are included. Geographically, this includes Maricopa County, a large part of Pinal County and a small
part of Yavapai county. In addition, "out of area" listings recorded on ARMLS are included, although these usually
constitute a very small percentage of total sales and have very little effect on the data.
All dwelling types are included. For-sale-by-owner, auctions and other non-MLS transactions are not included. Land,
commercial units, and multiple dwelling units are also excluded.
commercial units, and multiple dwelling units are also excluded.
City Ranking – Snapshot
This table ranks the cities by their annual average sales price per square foot. Only single family detached homes are
included in these numbers. Information for the large and secondary cities is current as of the date shown. Data for the
11 small cities is updated on a monthly basis, and is measured on the 13th of each month.The primary function of this
table is to show the least and most affordable areas in the Phoenix metropolitan area together with longer term pricing
trends.Annual averages are based on a relatively large number of sales. Therefore they are not as subject to rapid
change as monthly averages. The downside is that they do not necessarily represent the current market very
accurately, since they include sales from up to a year ago. Pricing may have moved a great deal since then.
Cromford Market Index
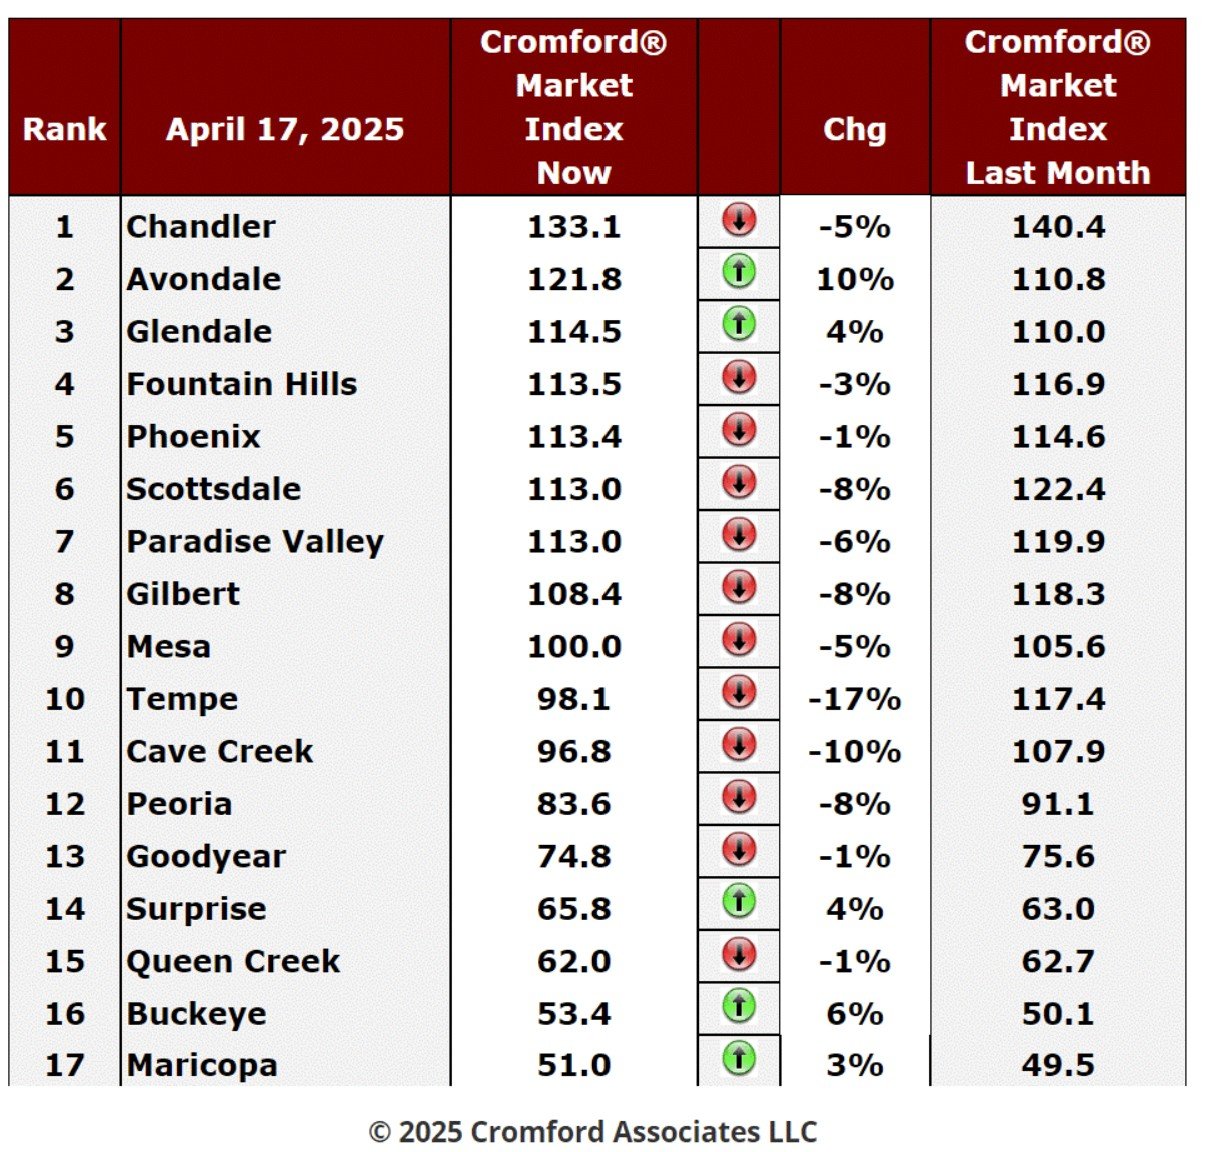
April 17 - Here is our latest table of Cromford® Market Index values for the single-family markets in the 17 largest
cities.
cities.
Cromford Market Index Commentary
The table is still showing a swing in favor of buyers. Like last week, we have 12 cities that have deteriorated for sellers
over the last month and 5 that have improved. Avondale is the only city with a high percentage improvement of 10%, while
Buckeye improved 6% and Glendale and Surprise managed another 4%. At the bottom of the table, Maricopa gave sellers
a modest gain of 3% but remains strongly favorable to buyers.
over the last month and 5 that have improved. Avondale is the only city with a high percentage improvement of 10%, while
Buckeye improved 6% and Glendale and Surprise managed another 4%. At the bottom of the table, Maricopa gave sellers
a modest gain of 3% but remains strongly favorable to buyers.
All the other cities moved in favor of buyers, with Tempe, Cave Creek, Scottsdale, Gilbert and Peoria the front runners in
that trend.
that trend.
The average change in CMI over the past month is -2.7% while last week we saw -2.9%. This continues the slow
decelerating trend that started a week ago, but represents a very small change, largely thanks to demand holding slightly
firmer. Supply continues to barrel higher, something it should not normally be doing in April. If it increases in April, then it
is likely to increase further during the second half of the year, unless conditions change drastically. If conditions stay on
their current track, sellers will have even more of a challenge in the second half of 2025 as each seller will be competing
with too many other sellers who are equally anxious to attract a firm offer. Price cuts and concessions are going to hit new
highs under these circumstances.
We have 7 cities that are still seller's markets, 4 that are balanced and 6 that are buyer markets. Two cities (Chandler and
Avondale) are above 120, but the other 5 seller's markets are only seller's markets by a very small margin with CMIs less
than 115. Such a weak seller's market is barely different from a balanced market. In other words, we have only 2 cities
where seller's can feel a detectable advantage.
Avondale) are above 120, but the other 5 seller's markets are only seller's markets by a very small margin with CMIs less
than 115. Such a weak seller's market is barely different from a balanced market. In other words, we have only 2 cities
where seller's can feel a detectable advantage.
The overall CMI has been moving lower since the third week of January and yet sales pricing has remained strong right
up to the end of the first quarter. However this overhang appears to be coming to a sudden end, as the median sales price
and average price per square foot for closed listings both have plummeted in the last 2 weeks. The former is down 1.7%
and the latter 2% in just 14 days. At this point in the year such a move is ominous, and we fear an overall CMI under 80
means prices will have to fall further from current levels to restore balance to the market. In fact the situation feels similar
to the second quarter of 2022, though then it was the iBuyers who took the worst of the punishment. iBuyers are now such
a small percentage of the market that we no longer notice their influence very much.
Days of Inventory – 5 Million and Above
Apr 14 - Looking at the very top of the market - homes priced at $5 million and above.
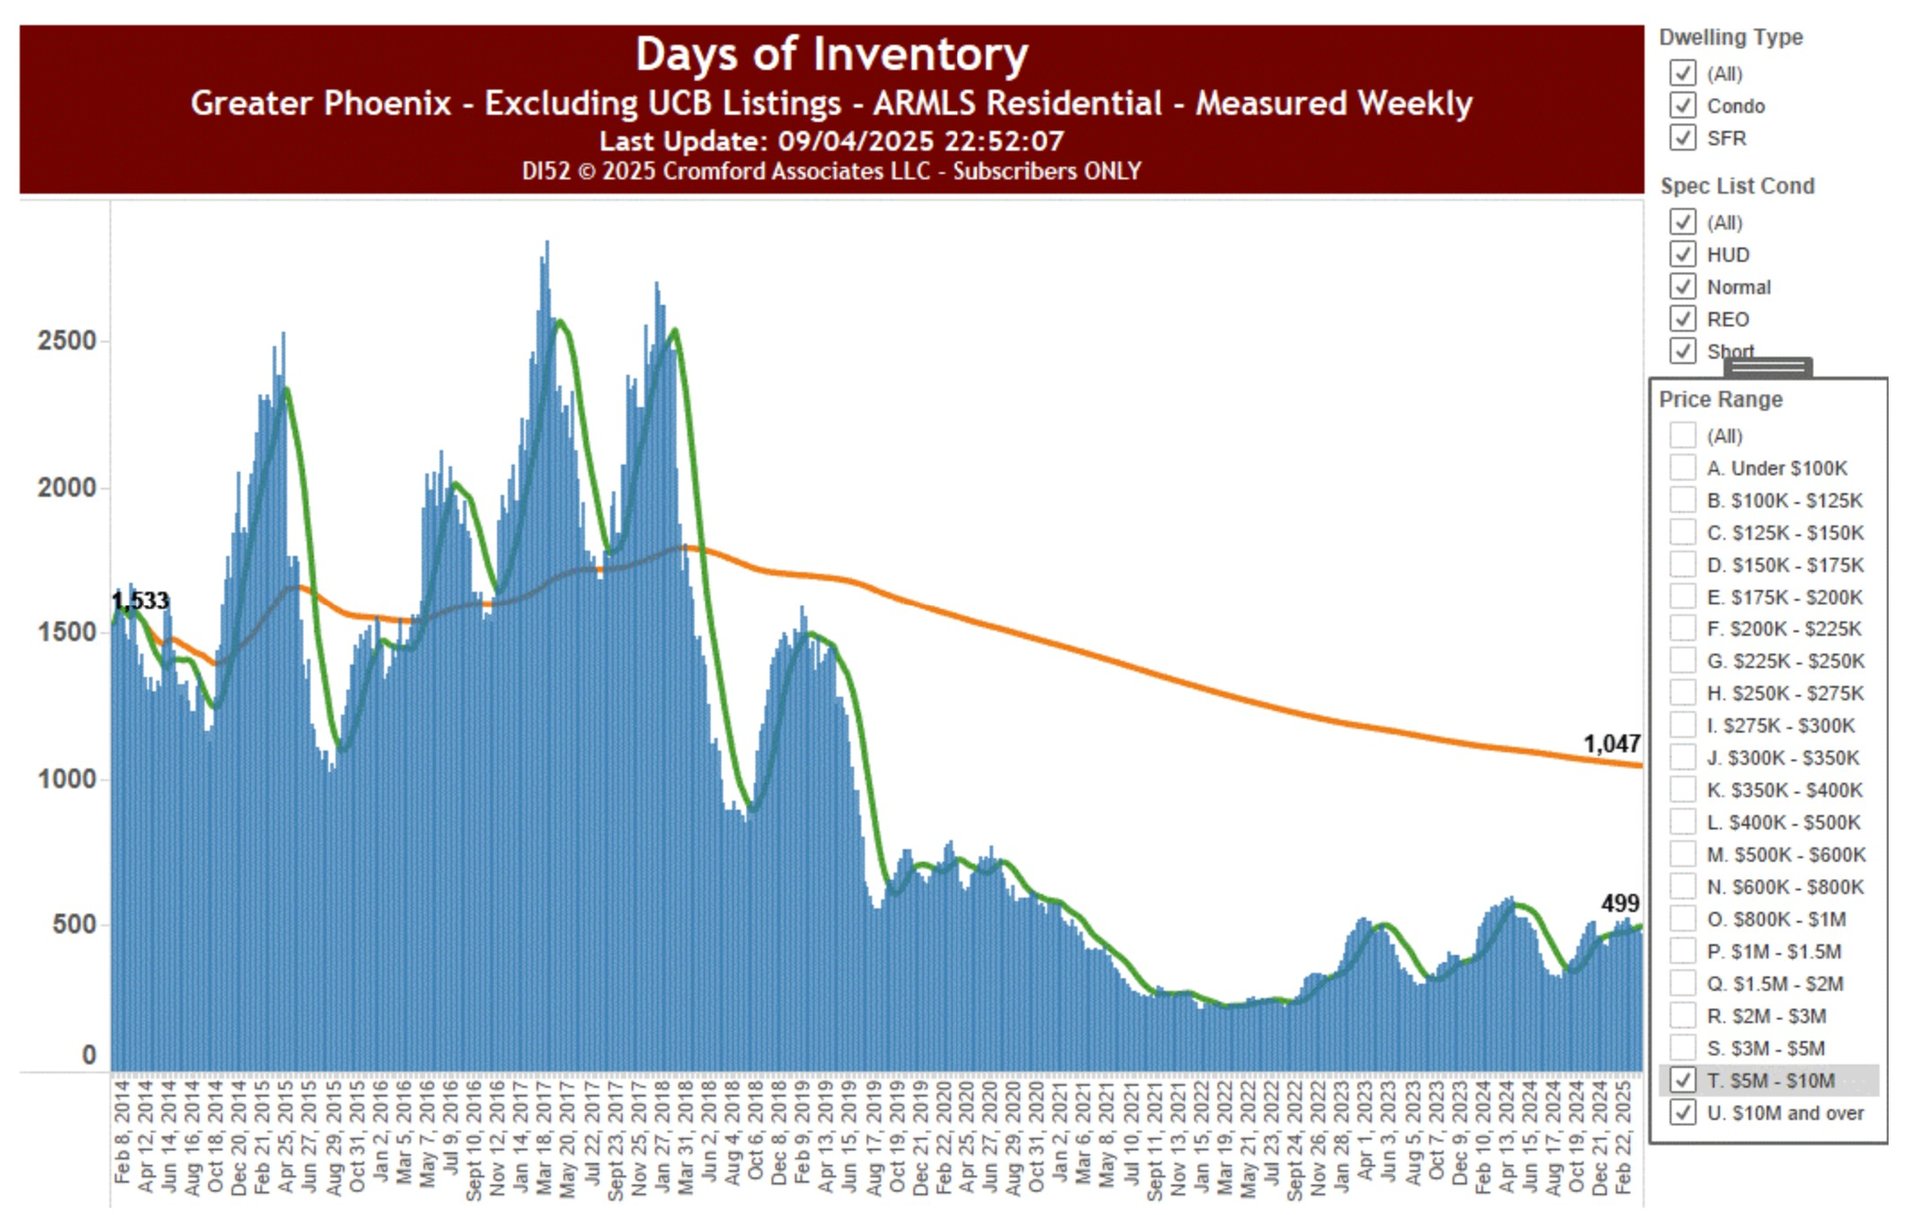
The obvious difference from the other market segments is that this high-end market always has a lot of inventory.
The least we have ever seen is 215 days and the long-term average is 1047 days.
The current inventory is less than half the long-term average at 499. There is also no strong upward trend as we
saw in other segments.
saw in other segments.
It does take a lot of time and effort to sell a home over $5 million, but market conditions have been pretty favorable
to sellers since 2020.
to sellers since 2020.
Days of Inventory – 1 to 5 Million
Apr 13 - Now it is the turn of the lower end of the luxury market priced from $1,000,000 to $5,000,000.
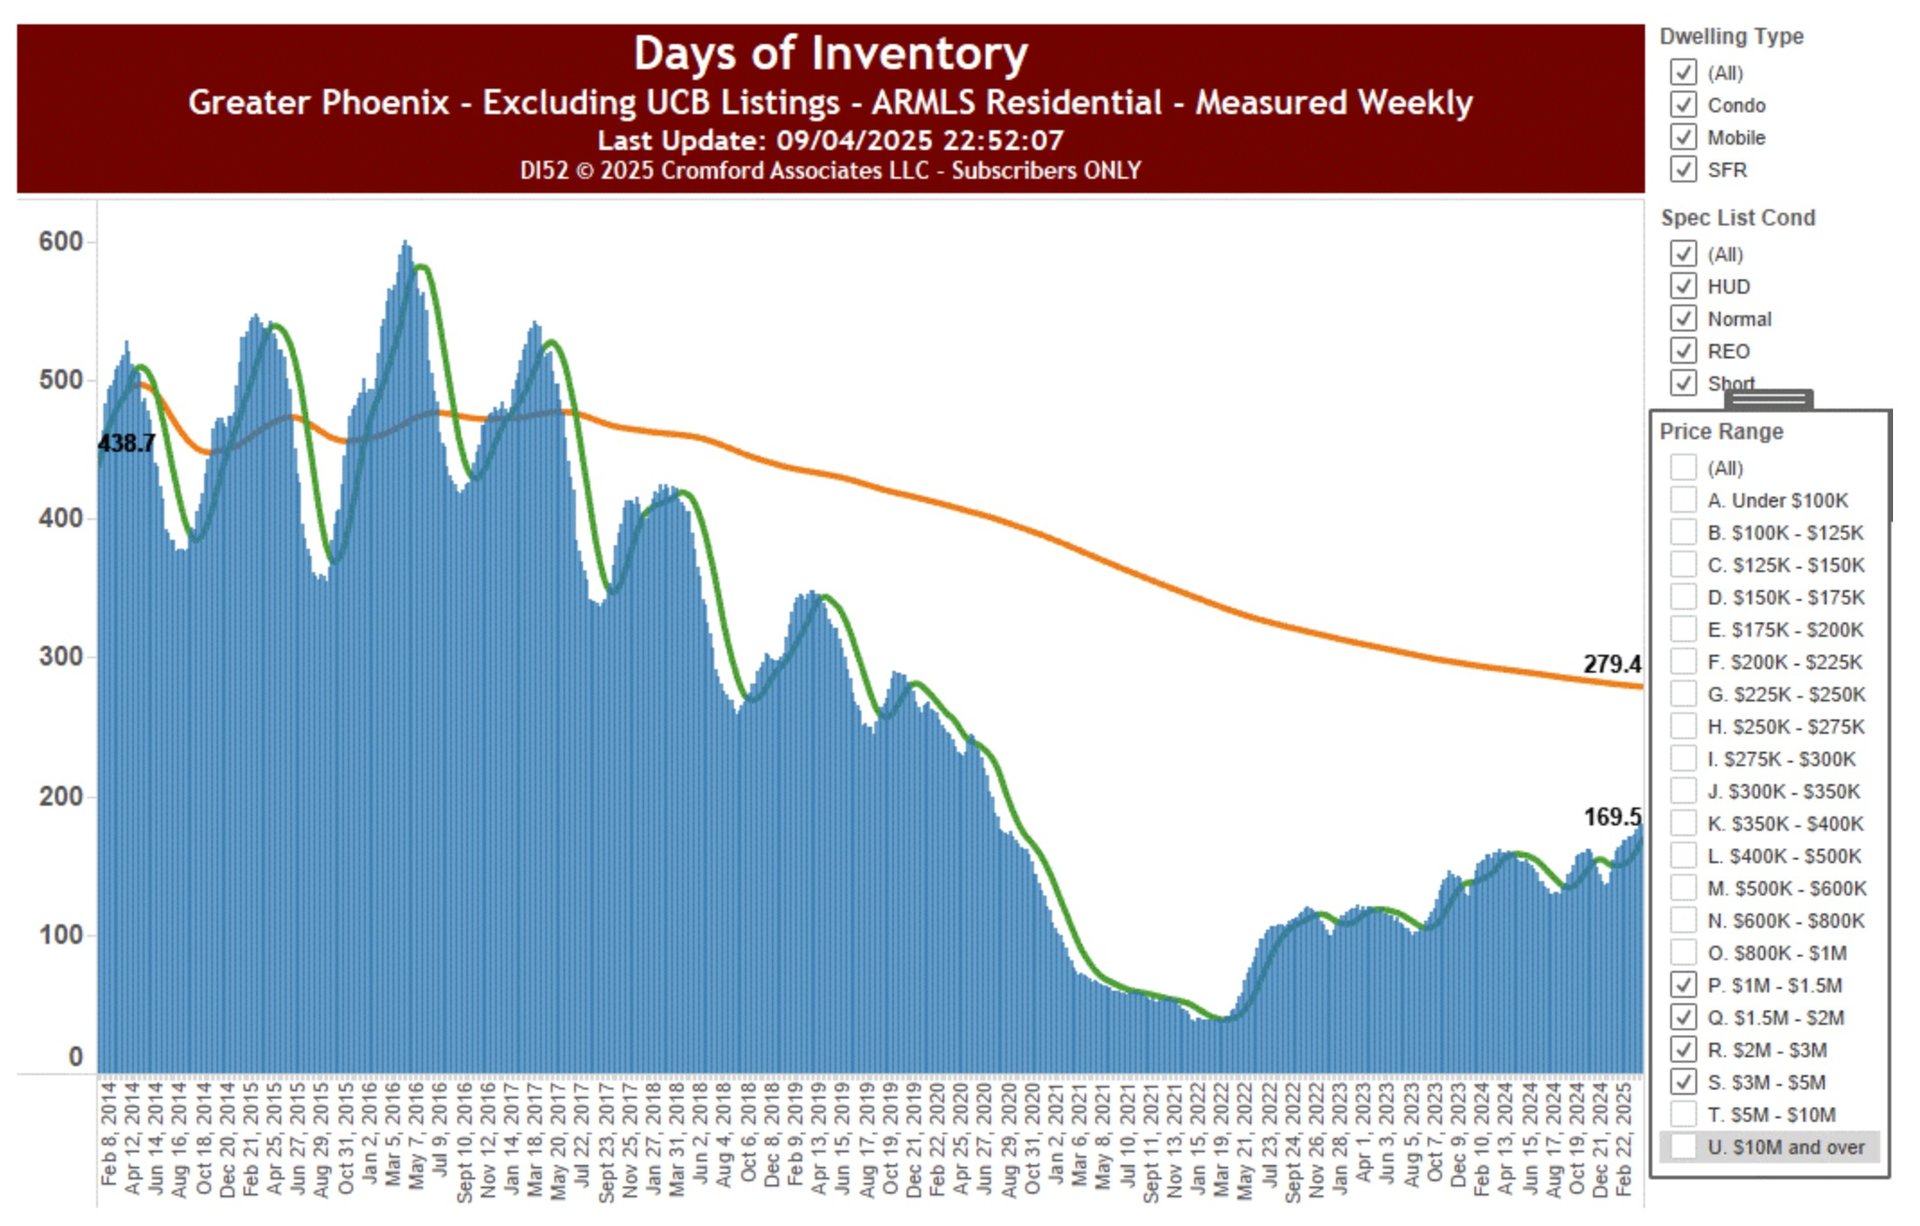
A very different picture emerges here. Although we have 169.5 days of inventory, this is far BELOW the long-term
average of 279.4. Indeed, it is far below any measurement between 2014 and 2019. The luxury market has
experienced far more demand than it used to and this has continued right up until recent weeks. We are wondering
if and when market volatility in other investments may start to curb luxury buyers' enthusiasm. During the COVID
pandemic, the supply of homes in this price range dropped to a record low of 38 days and we have seen a steady
upward trend since then.
We would describe 169.5 days of inventory as below normal and the lower end of the luxury market still favors
sellers for that reason. However, we would watch out for any consequences of the current economic uncertainty.
sellers for that reason. However, we would watch out for any consequences of the current economic uncertainty.
This might trigger a return towards the more normal inventory level around 280 days.
Days of Inventory – 300K to 1 Million
Apr 12 – Here we will turn to the price range $300,000 to $1,000,000 - the mid-range of our market.
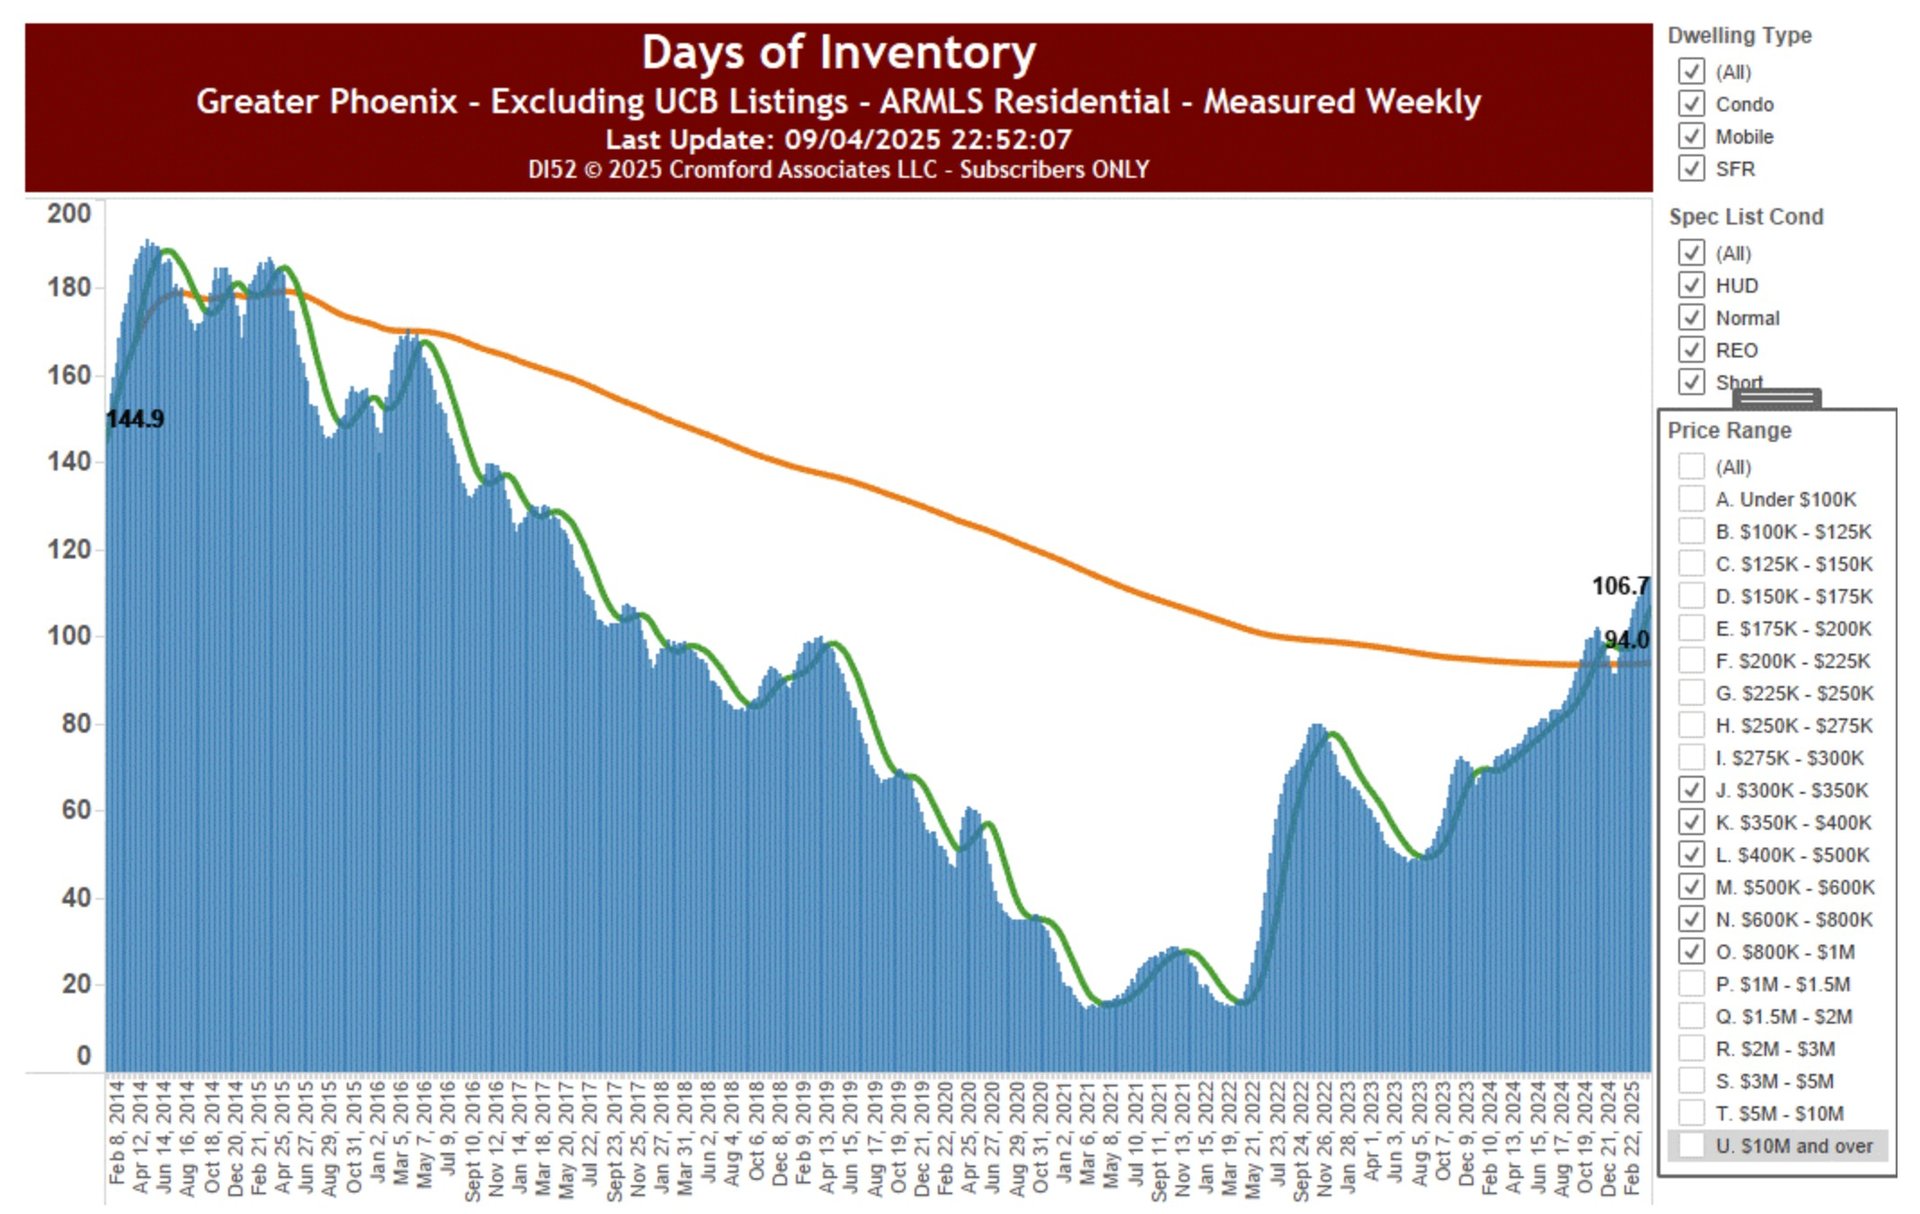
The long-term average days of inventory is 94.0 and we were below this level from 2017 until the third quarter of
last year. After a brief dip below this average in December, we are now heading higher again and have reached
106.7. This means the market is starting to create hard work for sellers though it is still below the levels of inventory
seen in 2014 and 2015.
last year. After a brief dip below this average in December, we are now heading higher again and have reached
106.7. This means the market is starting to create hard work for sellers though it is still below the levels of inventory
seen in 2014 and 2015.
Back during the COVID era we had only 20 to 30 days of inventory and homes were selling with multiple offers.
We are well-provisioned now, multiple offers are the exception rather than the rule, and and we are heading towards
a surplus of supply relative to demand. The market is still reasonably balanced but if we find ourselves north of 140
days then buyers will have established a strong advantage.
a surplus of supply relative to demand. The market is still reasonably balanced but if we find ourselves north of 140
days then buyers will have established a strong advantage.