Market Statistics Report for April 28, 2025
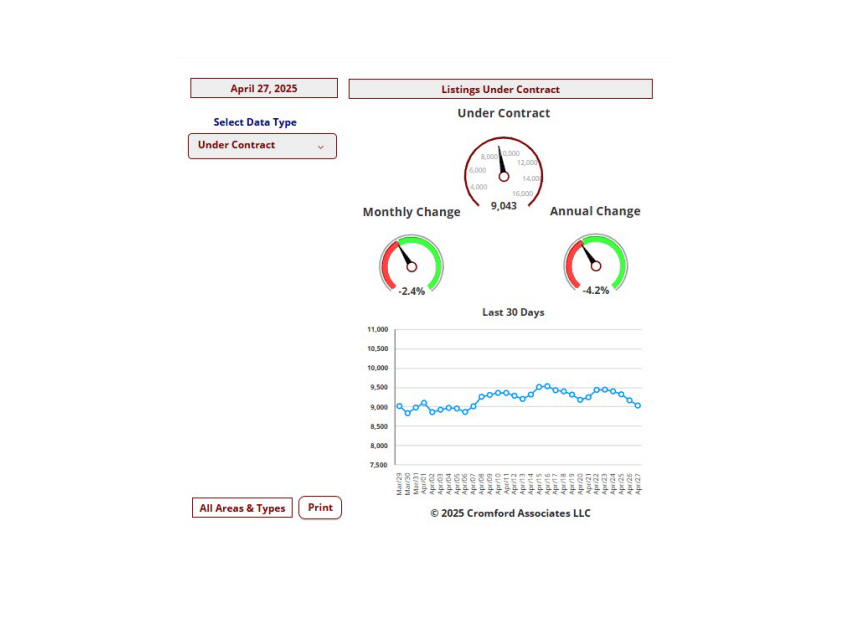
Market Dashboard – Listings Under Contract
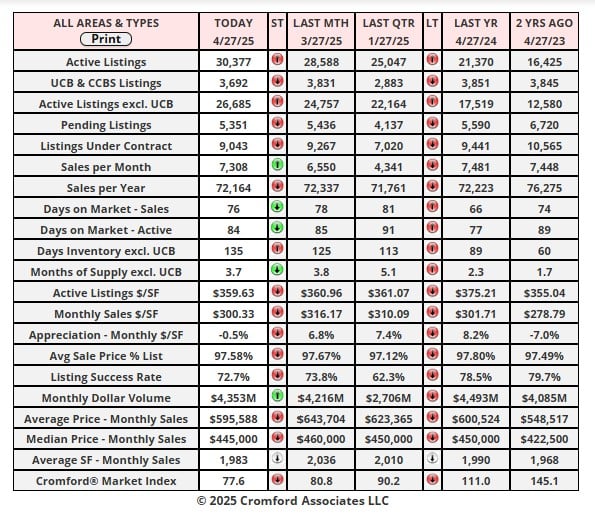
This Dashboard provides a comprehensive summary of the current state of the overall residential resale market.
All the statistics shown are for the entire Arizona Regional area as defined by ARMLS. All residential resale transactions
recorded by ARMLS are included. Geographically, this includes Maricopa County, a large part of Pinal County and a small
part of Yavapai county. In addition, "out of area" listings recorded on ARMLS are included, although these usually
constitute a very small percentage of total sales and have very little effect on the data.
All dwelling types are included. For-sale-by-owner, auctions and other non-MLS transactions are not included. Land,
commercial units, and multiple dwelling units are also excluded.
commercial units, and multiple dwelling units are also excluded.
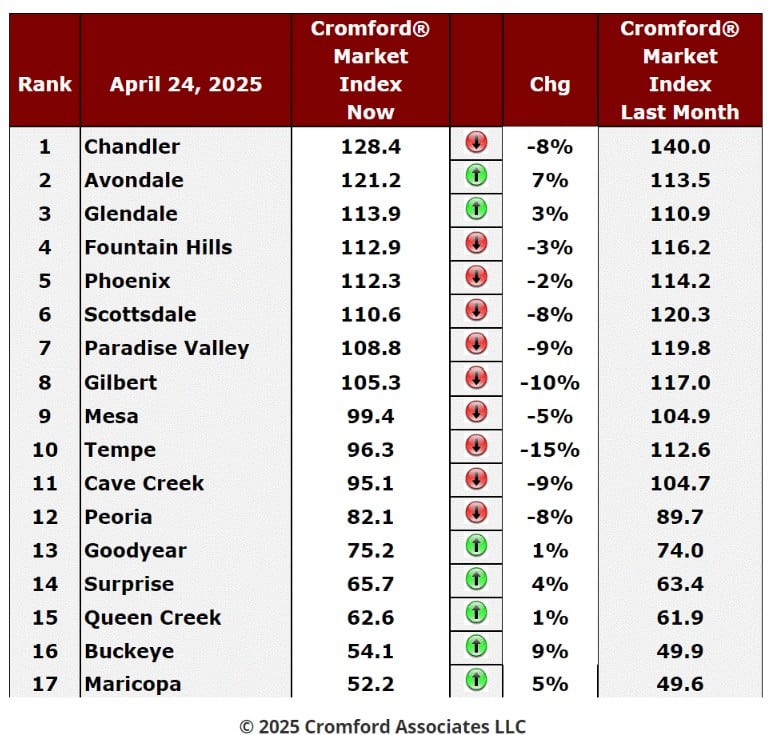
City Ranking – Snapshot
This table ranks the cities by their annual average sales price per square foot. Only single family detached homes are
included in these numbers. Information for the large and secondary cities is current as of the date shown. Data for the
11 small cities is updated on a monthly basis, and is measured on the 13th of each month.The primary function of this
table is to show the least and most affordable areas in the Phoenix metropolitan area together with longer term pricing
trends.Annual averages are based on a relatively large number of sales. Therefore they are not as subject to rapid
change as monthly averages. The downside is that they do not necessarily represent the current market very
accurately, since they include sales from up to a year ago. Pricing may have moved a great deal since then.
Cromford Market Index
April 24 - Here is our latest table of Cromford® Market Index values for the single-family markets in the 17 largest
cities.
cities.
Cromford Market Index Commentary
The first thing I noticed about this week's table is that the bottom 5 cities have improved for sellers over the last month.
Avondale and Glendale also trended in that direction. That makes 7 cities in the green camp leaving 10 cities improving
for buyers. This is the highest number of green dots since the end of January, so is the deteriorating trend coming to an
end? Not exactly. The average change in CMI is -2.8% which is up a shade from last week's -2.7%. The cities moving in
a direction which is unfavorable for sellers show generally higher percentages in that direction, particularly Tempe, Gilbert,
Cave Creek, Scottsdale and Paradise Valley. We are seeing a deterioration in market conditions in the more expensive
areas and a smaller improving trend at the bottom end of the market. Congratulations to Buckeye and Avondale as leaders
of that latter trend. Overall things are still getting worse for sellers and that is starting to show up in all out price
measurements.
We have 6 cities that are seller's markets (4 of these very weak seller's markets), 5 are balanced and the remaining 6 are
buyer's markets.
buyer's markets.
The overall CMI for all areas & types stands at 78, firmly in buyer's market territory and heading south at a slow but steady
pace. Supply is still growing, and demand is low but steady with a glacial trend upwards. We would need something new
to happen to spark a significant improvement in demand. Prices are starting to decline and so are mortgage rates so
affordability is on an uptrend. The movement is pretty slow for interest rates but quite sharp for prices. The cooling off at
the top of the market has a lot to do with that. However the top end has almost no effect on the monthly median sales
price and that has declined from $465,000 to $445,000 over the past 5 weeks. We deduce that a clear downward trend in
home prices has now been established. With the hottest months still in front of us, that is not likely to reverse anytime
soon.
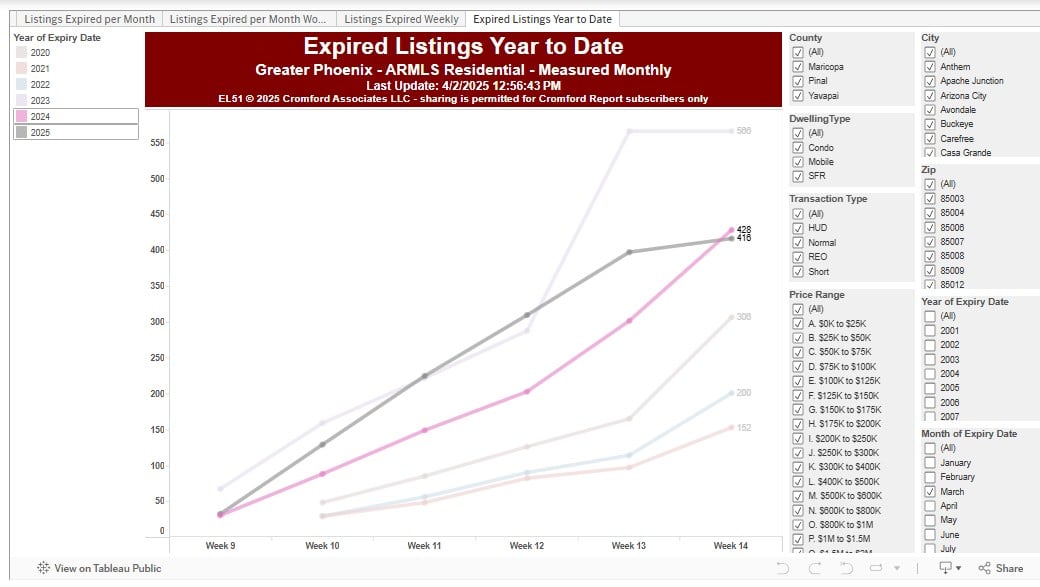
Listings Under Contract – All Prices – 2024 vs 2025
pace. Supply is still growing, and demand is low but steady with a glacial trend upwards. We would need something new
to happen to spark a significant improvement in demand. Prices are starting to decline and so are mortgage rates so
affordability is on an uptrend. The movement is pretty slow for interest rates but quite sharp for prices. The cooling off at
the top of the market has a lot to do with that. However the top end has almost no effect on the monthly median sales
price and that has declined from $465,000 to $445,000 over the past 5 weeks. We deduce that a clear downward trend in
home prices has now been established. With the hottest months still in front of us, that is not likely to reverse anytime
soon.
Listings Under Contract – All Prices – 2024 vs 2025
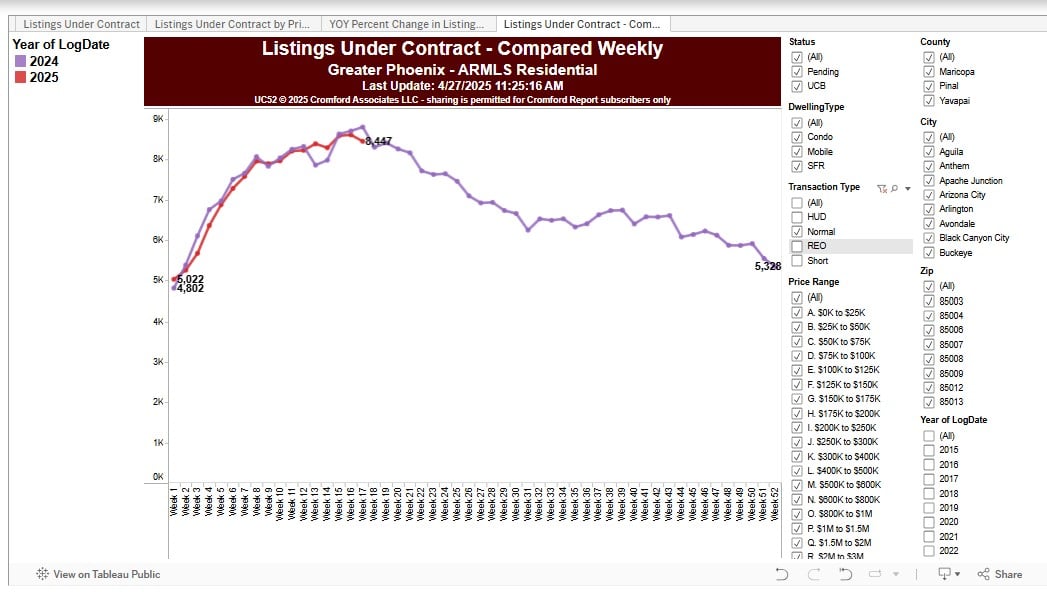
The good news is that while counts were lagging behind during the first couple of months of 2025, they have been
exceeding 2024 counts for the last several weeks (Under 1 million). Pricing has adjusted downward in the low and
mid-range, as evidenced by the overall median sales price dropping back to $450,000. Demand seems to be
responding, albeit tentatively. The luxury market tends to have very little impact on the monthly median sales
price but has a strong influence on the average price and the average $/SF.
Expired Listings YTD 2024 vs 2025