
All the statistics shown are for the entire Arizona Regional area as defined by ARMLS. All residential resale transactions
recorded by ARMLS are included. Geographically, this includes Maricopa County, a large part of Pinal County and a small
part of Yavapai county. In addition, "out of area" listings recorded on ARMLS are included, although these usually
constitute a very small percentage of total sales and have very little effect on the data.
All dwelling types are included. For-sale-by-owner, auctions and other non-MLS transactions are not included. Land,
commercial units, and multiple dwelling units are also excluded.
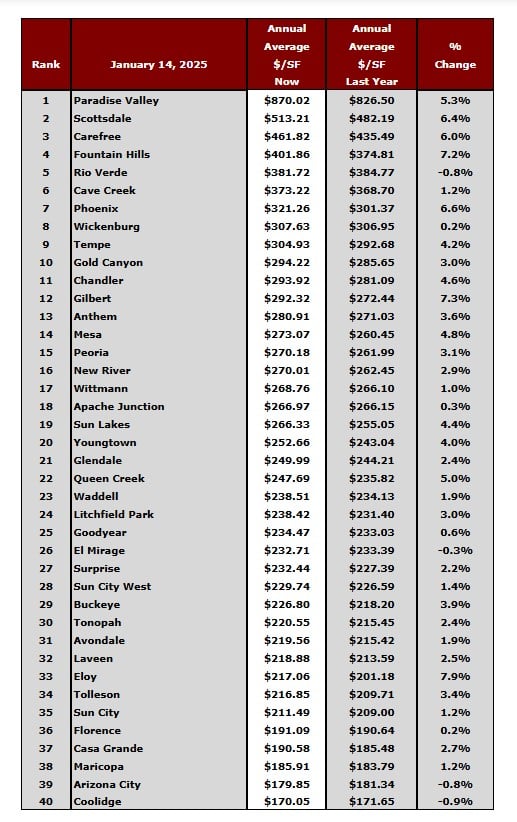
included in these numbers. Information for the large and secondary cities is current as of the date shown. Data for the
11 small cities is updated on a monthly basis, and is measured on the 13th of each month.The primary function of this
table is to show the least and most affordable areas in the Phoenix metropolitan area together with longer term pricing
trends.Annual averages are based on a relatively large number of sales. Therefore they are not as subject to rapid
change as monthly averages. The downside is that they do not necessarily represent the current market very
accurately, since they include sales from up to a year ago. Pricing may have moved a great deal since then.
cities.
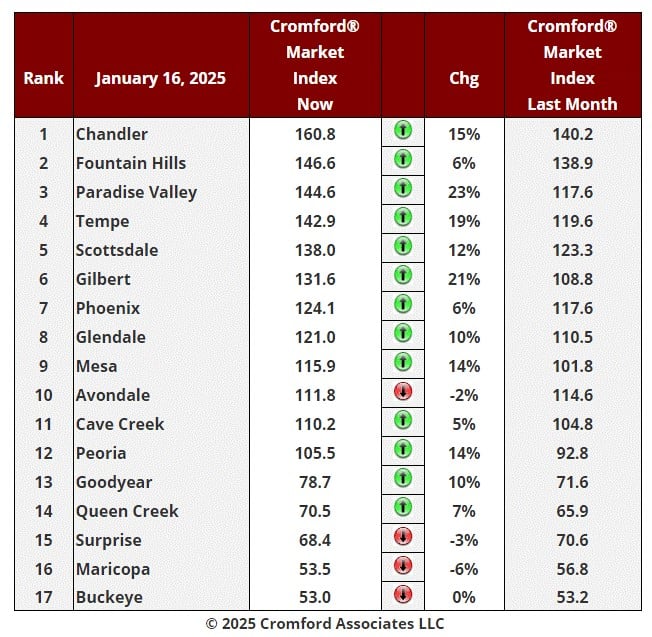
Cromford Market Index Commentary
The market situation is looking less positive than last week. We now have twice as many cities that have
deteriorated for sellers over the past month with Avondale and Buckeye joining Maricopa and Surprise. We
still have 13 cities that have shown improvement over the past month, but most of that improvement
happened in the last 2 weeks of December and the January situation has been less favorable for sellers.
The average change in CMI over the past month is +8.7% while last week we saw +10.4%. The CMI appears
to have peaked and turned around and is now starting on a falling trend.
There are still plenty of cities showing double figure percentage improvements - Paradise Valley, Gilbert,
Tempe, Mesa, Peoria, Scottsdale, Goodyear and Glendale and all in that happy group. But this is because
December 16 to January 2 saw a large fall in supply and this is now in the process of being reversed. Some
of these improving cities even saw their CMI drop over the last week, including Fountain Hills, Paradise Valley
and Cave Creek. This is not a good look for mid-January.
Buyers at the lower end of the market are not enjoying mortgage rates over 7% at all. It it noticeable that the
top of the table is populated by more expensive cities while most of those with more affordable prices are
languishing at the bottom of the table.
We now have 11 cities that are seller's markets, only 1 that is balanced and 5 that are buyer's markets. Those
5 still have a long way to go to get back to balance, although Goodyear and Queen Creek are making a good
try for it.
Among the secondary cities, Sun City, Casa Grande, Sun City West, Litchfield Park and Arizona City are
buyer's markets. Gold Canyon and Laveen are balanced while El Mirage, Apache Junction, Anthem and
Tolleson are seller's markets. Sun Lakes is also a seller's market but only by the skin of its teeth with a CMI
at 110.7.
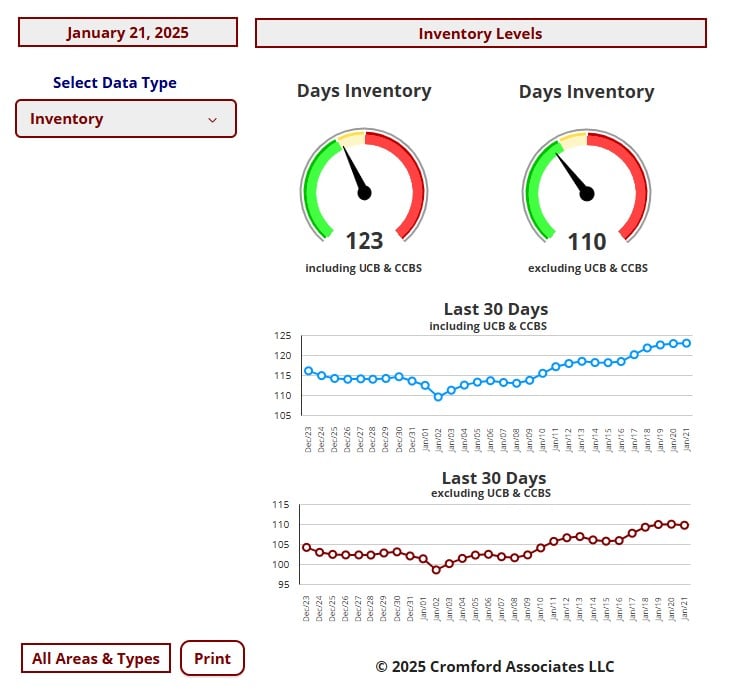
Market Trends – Inventory
Jan 19 - Since the beginning of this year we have seen an increase of 2,324 in the active listing count
(excluding those with a contract). This a 11.9% rise, which is much higher than the 8.1% increase we
saw this time last year, and it is added to a base of 19,460 rather than 14,593. So it is safe to conclude
that supply is both higher and growing more quickly than a year ago.
Listings under contract have also shown some growth - up 13.3% from 5,387 to 6,103. This time last
year they grew 23.8% over the same period. We have gained only 716 listings under contract instead
of 1,257 last year and the growth percentage is down 44%.
We are therefore seeing demand grow, as is normal for the season but at a significantly slower rate
than in January 2024.
So if supply is growing faster than a year ago, but demand is growing more slowly, the
comparison with 2024 looks discouraging for sellers. Many readings confirm this picture.
• The contract ratio is stuck below 30 and currently reads 28. Last year it was 41 and was on a strong
upward trend.
• The percentage of final list achieved by closed listings is currently standing at 97.15%, down from
97.40% a year ago.
• We have 123 days of inventory versus 92 this time last year and the trend is upwards.
• The listing success rate is 64.3% versus 69.7% last year.
This situation will result in more difficulty for sellers in resisting negotiation demands from potential
buyers. New competition from other sellers is appearing quickly and asking prices will need to be set to
be competitive and attractive rather than complacent. A price which is initially set higher than the market
can bear will result in a long marketing period and eventually deeper price cuts than if the price had
been set properly in the first place. This is particularly true at the low and mid-range price points. Those
with high-end luxury properties for sale may be more lucky, but their marketing cycles are always far
longer anyway.