
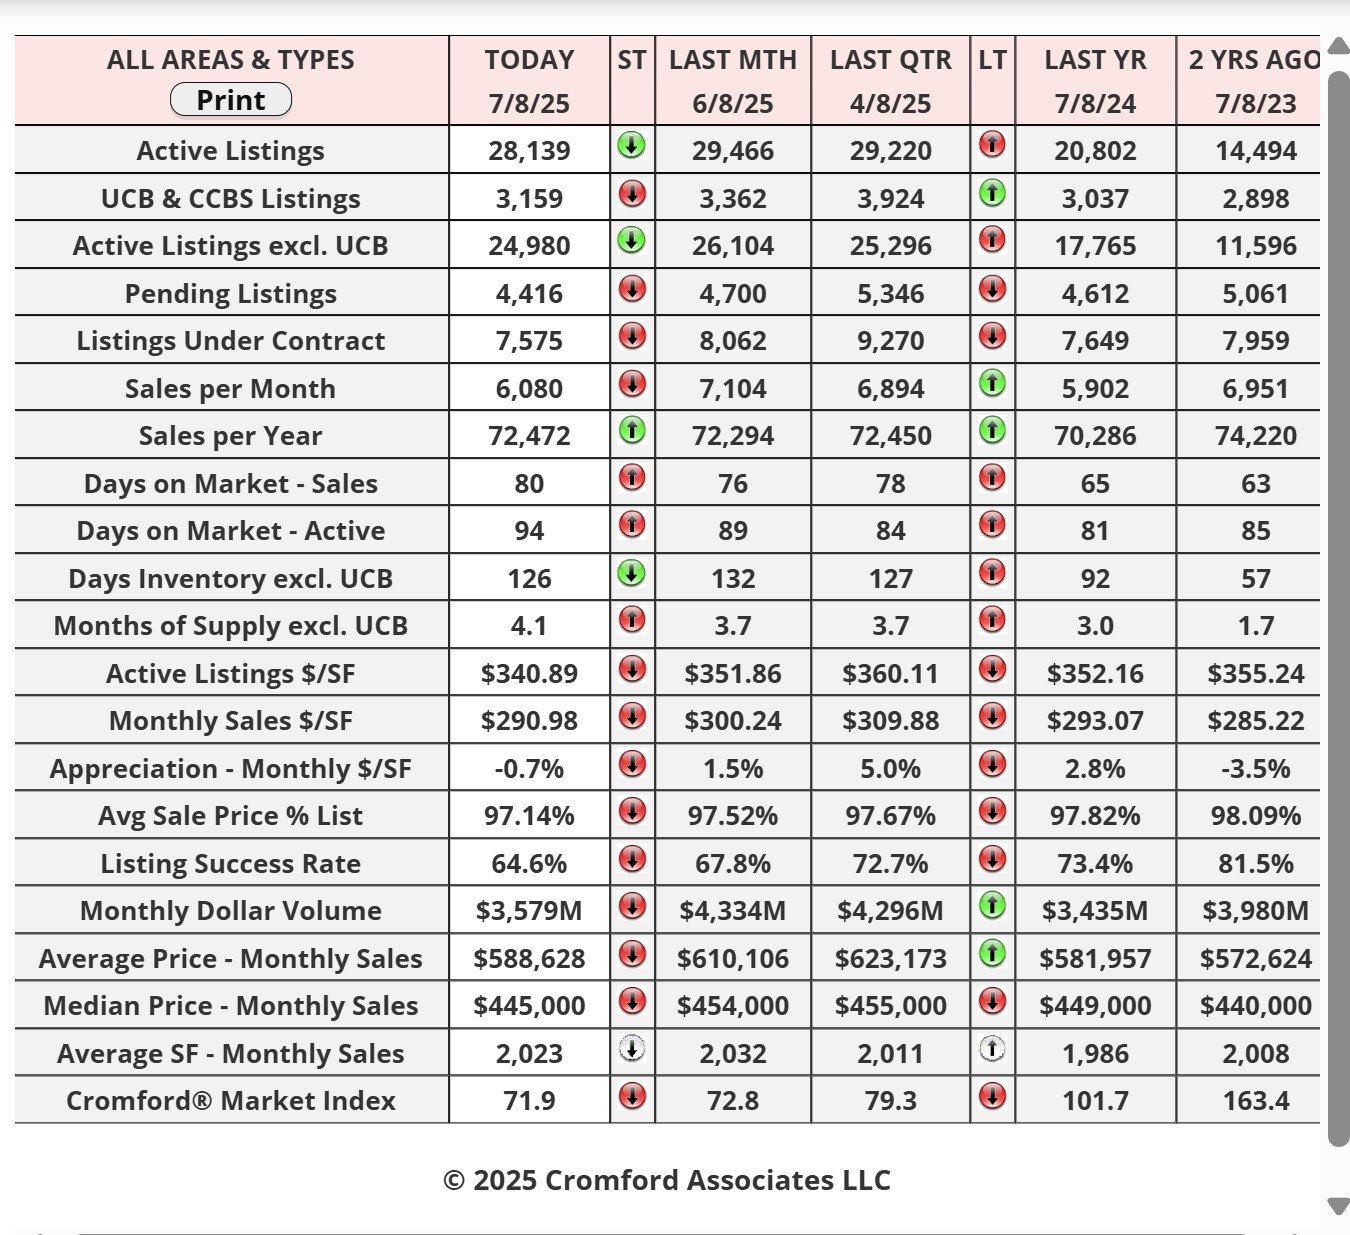
Market Statistics Report for July 9, 2025
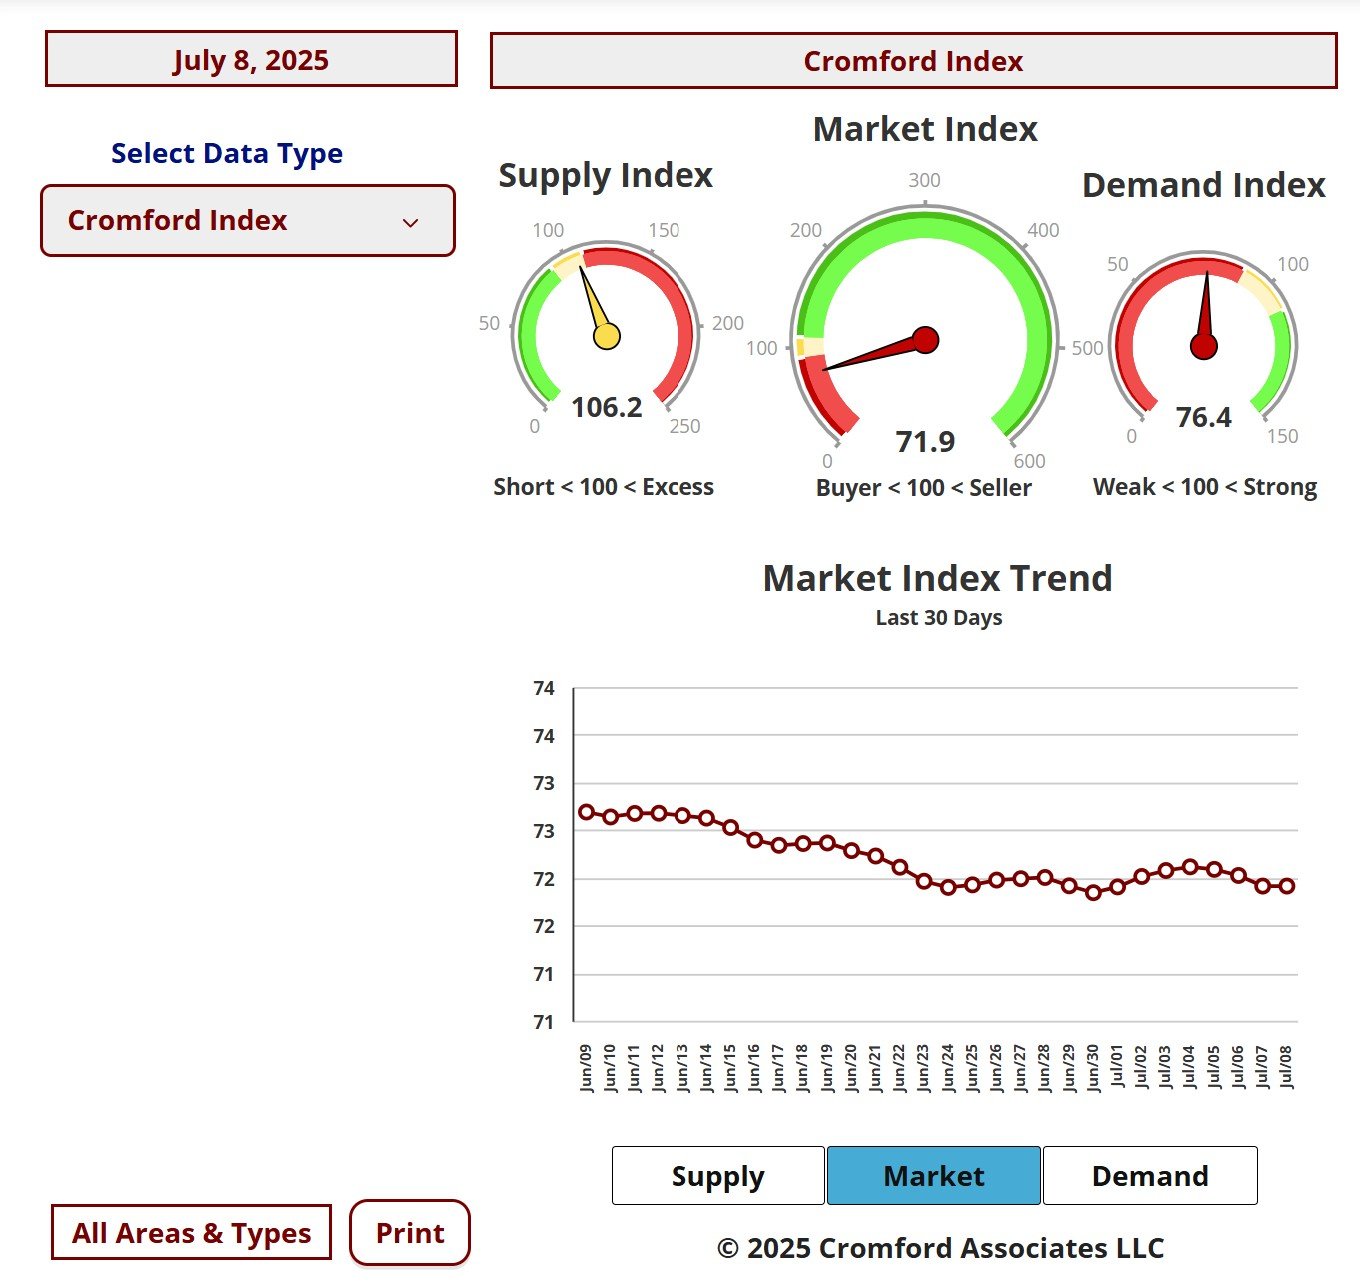
Market Dashboard – Dashboard Cromford Index
This Dashboard provides a comprehensive summary of the current state of the overall residential resale market.
All the statistics shown are for the entire Arizona Regional area as defined by ARMLS. All residential resale transactions
recorded by ARMLS are included. Geographically, this includes Maricopa County, a large part of Pinal County and a small
part of Yavapai county. In addition, "out of area" listings recorded on ARMLS are included, although these usually
constitute a very small percentage of total sales and have very little effect on the data.
All dwelling types are included. For-sale-by-owner, auctions and other non-MLS transactions are not included. Land,
commercial units, and multiple dwelling units are also excluded.
City Ranking – Snapshot
This table ranks the cities by their annual average sales price per square foot. Only single family detached homes are
included in these numbers. Information for the large and secondary cities is current as of the date shown. Data for the
11 small cities is updated on a monthly basis, and is measured on the 13th of each month.The primary function of this
table is to show the least and most affordable areas in the Phoenix metropolitan area together with longer term pricing
trends.Annual averages are based on a relatively large number of sales. Therefore they are not as subject to rapid
change as monthly averages. The downside is that they do not necessarily represent the current market very
accurately, since they include sales from up to a year ago. Pricing may have moved a great deal since then.
Cromford Market Index
July 3- Here is our latest table of Cromford® Market Index values for the single-family markets in the 17 largest
cities.
cities.
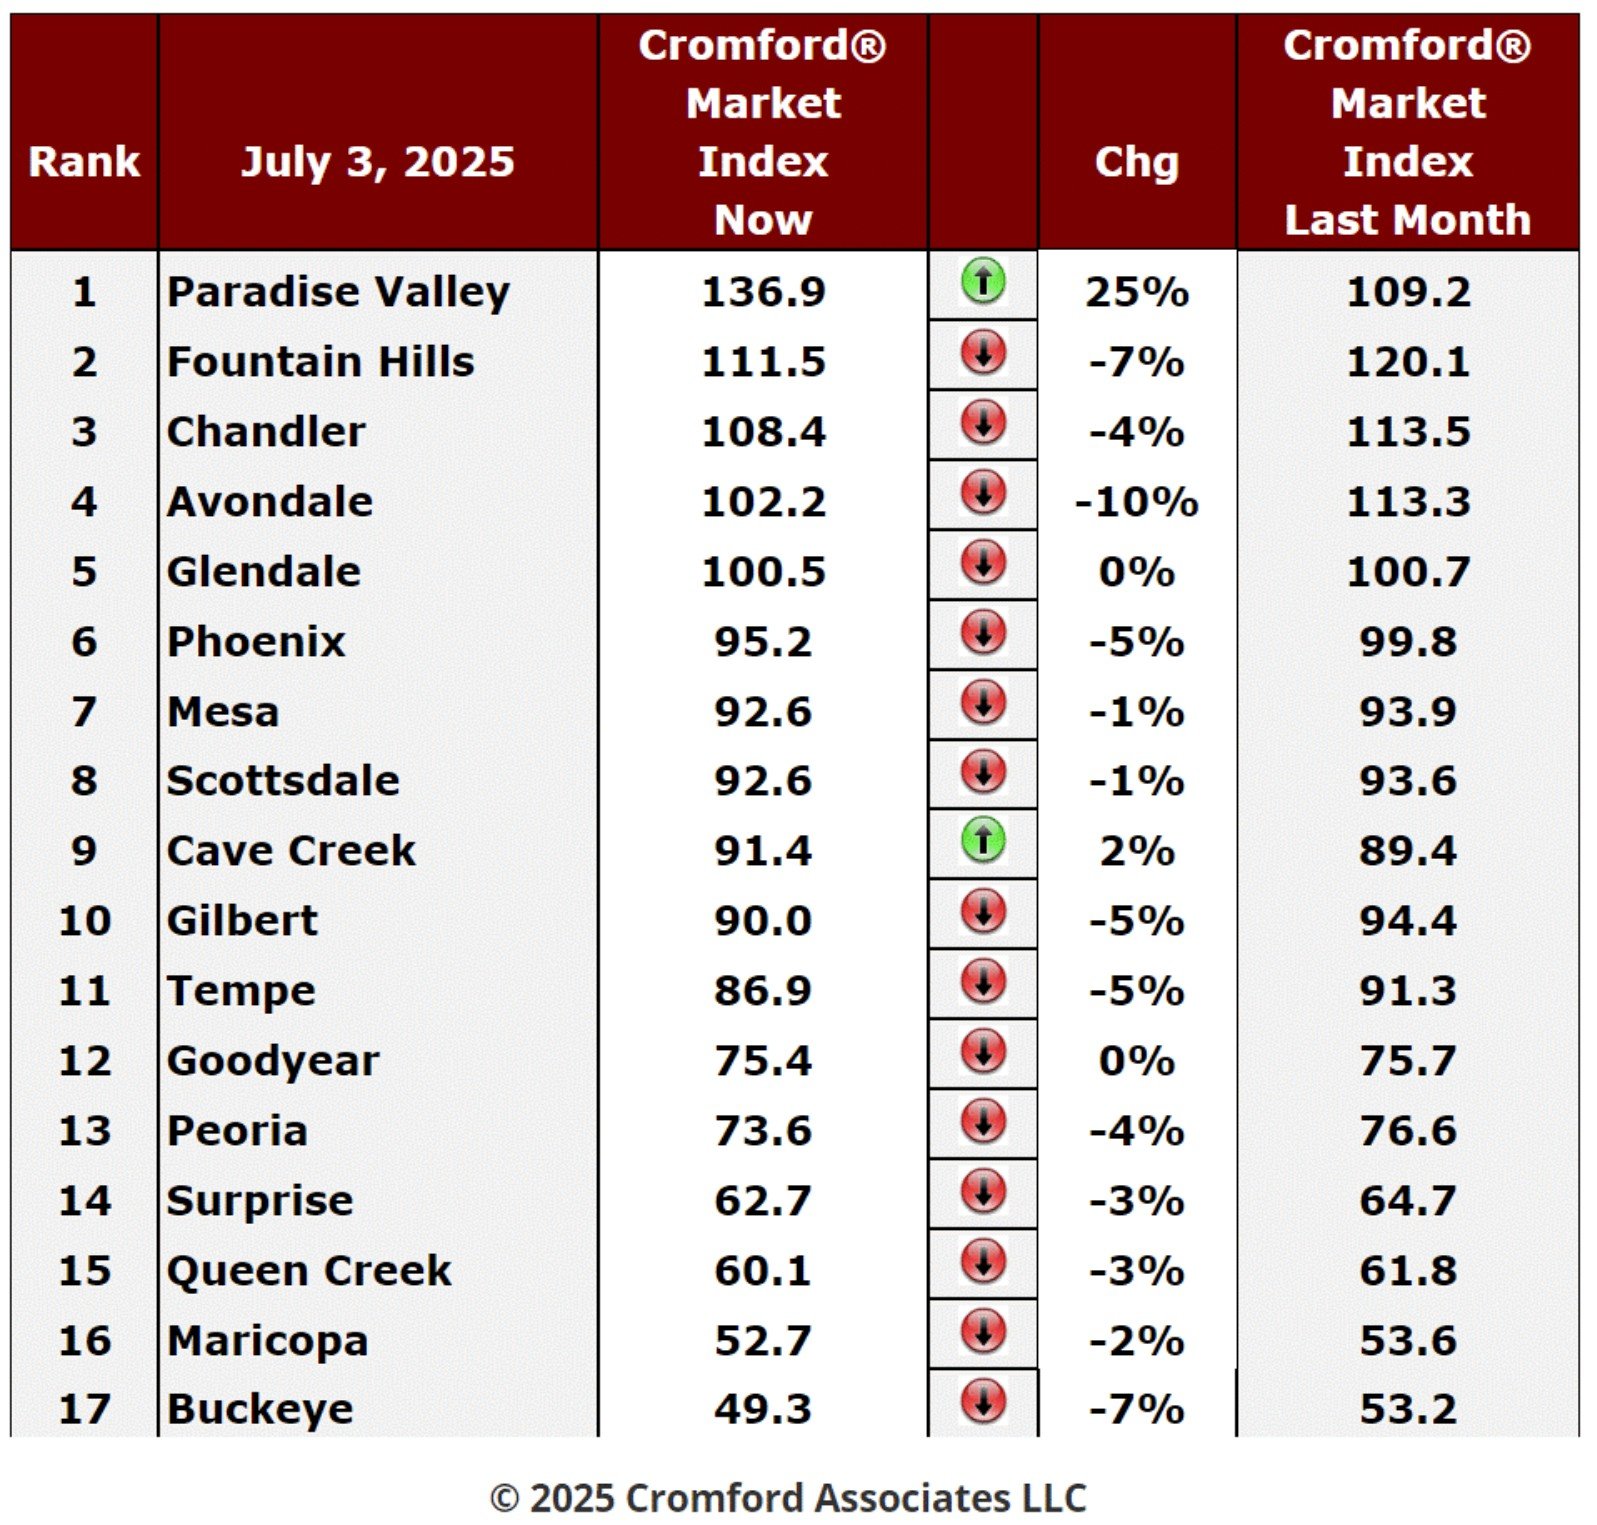
Cromford Market Index Commentary
Another week in which the market got less favorable for sellers, but the trend is weakening. The average monthly
change in CMI is -1.7% which is less negative than -2.7% last week.
change in CMI is -1.7% which is less negative than -2.7% last week.
One city has joined Paradise Valley in improving for sellers over the last month, Cave Creek, which has slipped
back into a balanced market having briefly become a buyer's market. Paradise Valley is on a strong upward trend
with +25%.
back into a balanced market having briefly become a buyer's market. Paradise Valley is on a strong upward trend
with +25%.
The other 15 cities went backwards, but the majority by small percentages. Avondale was worst affected, dropping
by 10% with Buckeye and Fountain Hills next with -7%
by 10% with Buckeye and Fountain Hills next with -7%
We have 2 cities that are seller markets (1 of which is a very weak seller market), 8 are balanced and the remaining
7 are buyer markets.
Affidavits of Value - Analyzed
7 are buyer markets.
Affidavits of Value - Analyzed
Jul 3 - The affidavits of value have been counted and analyzed for Maricopa County's June filings and here is what
we found:
we found:
• There were 6,621 closed transactions, down 0.2% from 6,633 in June 2024 and down 6.5% from May.
• There were 1,379 new homes closed, down 13% from 1,585 in June 2024 and down 8.2% from May.
• There were 5,242 closed re-sale transactions, up 3.8% from 5,048 in June 2024 but down 6.0% from May.
• The overall median sales price was $480,000, up 1.1% from June 2024 but down 1.0% from May.
• The new home median sales price was $528,349, up 4.9% from June 2024 and up 1.6% from May.
• The re-sale median sales price was $459,994, down 1.1% from June 2024 and down 2.3% from May.
June 2025 had 20 working days while June 2024 had only 19 so we should expect June 2025 sales numbers to be 5% higher than June 2024, all other things being equal.
Re-sale and new home numbers went in opposite directions.
Re-sale transactions were up almost 4%, less than the expected 5%, but not by much. New home sales crashed
by 13% compared with a year ago, and unexpectedly poor performance, especially compared to the 5% increase
expected.
Re-sale transactions were up almost 4%, less than the expected 5%, but not by much. New home sales crashed
by 13% compared with a year ago, and unexpectedly poor performance, especially compared to the 5% increase
expected.
Re-sale prices dropped, down 2.3% from a year ago. Given that the most recent CPI increased 2.4%, this
represents a significant increase in affordability.
represents a significant increase in affordability.
New home prices rose 1.1% from year ago, but when adjusted for inflation using the most recent CPI, this
represents a small increase in affordability.
represents a small increase in affordability.
Overall I would describe these numbers as not good, but not terrible. There has been a distinct deterioration in the
market for sellers, but the downward momentum is slowing rather than accelerating. New home builders have
growing inventories and this is their weakest since June 2019, so they are likely to slow down their start volumes a
little to give more time to sell what they already have as specs or under construction.