
Market Statistics Report for March 26, 2025
Market Dashboard – Dashboard
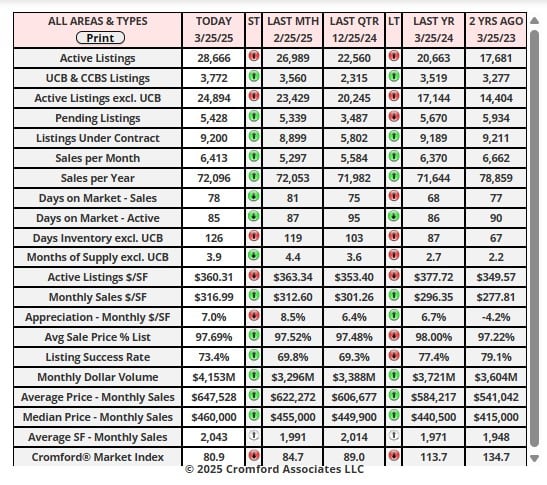
This Dashboard provides a comprehensive summary of the current state of the overall residential resale market.
All the statistics shown are for the entire Arizona Regional area as defined by ARMLS. All residential resale transactions
recorded by ARMLS are included. Geographically, this includes Maricopa County, a large part of Pinal County and a small
part of Yavapai county. In addition, "out of area" listings recorded on ARMLS are included, although these usually
constitute a very small percentage of total sales and have very little effect on the data.
All dwelling types are included. For-sale-by-owner, auctions and other non-MLS transactions are not included. Land,
commercial units, and multiple dwelling units are also excluded.
commercial units, and multiple dwelling units are also excluded.

City Ranking – Snapshot
This table ranks the cities by their annual average sales price per square foot. Only single family detached homes are
included in these numbers. Information for the large and secondary cities is current as of the date shown. Data for the
11 small cities is updated on a monthly basis, and is measured on the 13th of each month.The primary function of this
table is to show the least and most affordable areas in the Phoenix metropolitan area together with longer term pricing
trends.Annual averages are based on a relatively large number of sales. Therefore they are not as subject to rapid
change as monthly averages. The downside is that they do not necessarily represent the current market very
accurately, since they include sales from up to a year ago. Pricing may have moved a great deal since then.
Cromford Market Index
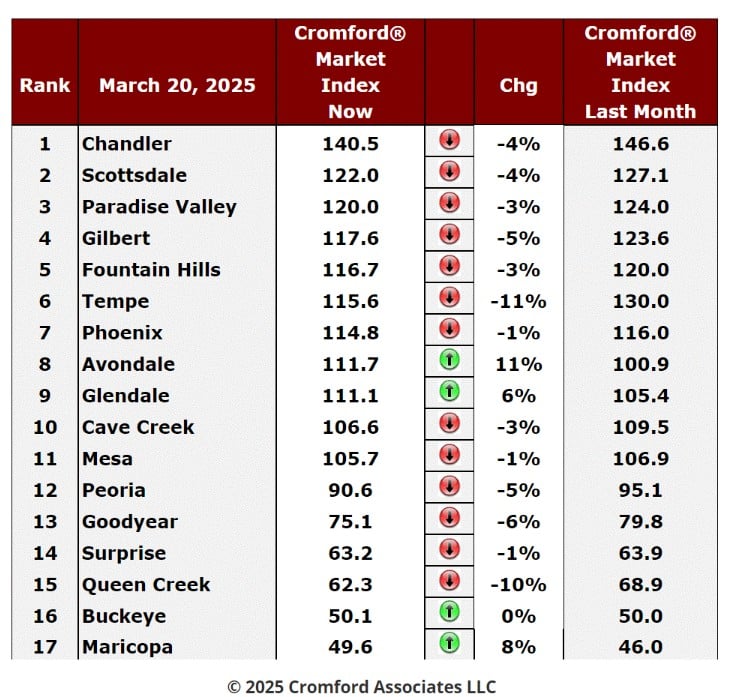
March 20 - Here is our latest table of Cromford® Market Index values for the single-family markets in the 17 largest
cities.
cities.
Cromford Market Index Commentary
The table is still reporting a swing in favor of buyers but the swing has stopped slowing down and is now
starting to accelerate again. We have 14 cities that have deteriorated for sellers over the last month and 4
that have improved. Cave Creek dropped out from the improving group. The average change in CMI over the
past month is -1.9% while last week we saw -1.5%. This ends the trend that started 4 weeks ago and starts
a new one. The difference is only slight, however.
The fastest decliners are Tempe and Queen Creek, which includes the large unincorporated county area
known as San Tan Valley. All other decliners fell by less than 7%.
known as San Tan Valley. All other decliners fell by less than 7%.
We have 9 cities that are still seller's markets, 3 that are balanced and 5 that are buyer's markets.
Avondale and Glendale moved from balanced to a very weak seller's market, joining Phoenix, Tempe,
Fountain Hills and Gilbert in the zone between 110 and 120. Only 3 cities are at 120 or higher, We can
see that although there are 9 cities that are still technically seller's markets they are all below 141 so
not strongly favoring sellers. However, the 5 cities that are buyer's markets very strongly favor
buyers, especially Maricopa and Buckeye.
Although we are in the peak of the buying season, supply is still outstripping demand. Confirming this view,
the homebuilders are reporting slightly disappointing sales given the elevated level of incentives.
Although the slope is not steep, the direction of the market remains downhill.
Foreclosures – Weekly Pending Chart
the homebuilders are reporting slightly disappointing sales given the elevated level of incentives.
Although the slope is not steep, the direction of the market remains downhill.
Foreclosures – Weekly Pending Chart
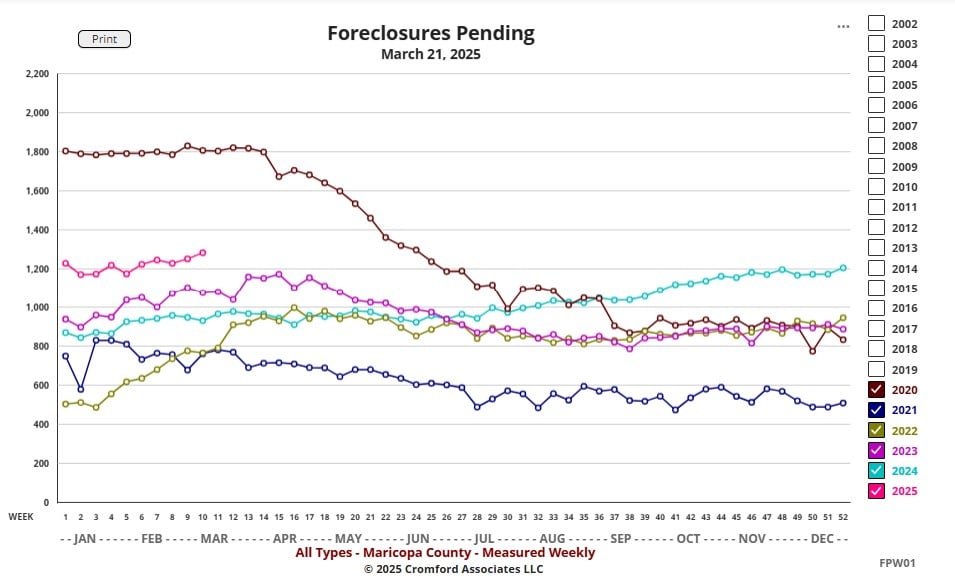
Mar 21 - The number of foreclosures pending in Maricopa County is very slowly creeping back towards the
level it was in 2020, before the pandemic. The number started at 870 at the beginning of last year, reached
1,206 by the end of December and is currently around 1,300.
While this is still low by long-term standards, we are now at the highest level since mid-2020 and the trend
suggests we will reach between 1,500 and 1,700 by the end of the year.
Before anyone who started real-estate after 2020 starts to panic, the lowest number we saw before the
pandemic was 1,800 and during the worst of the foreclosure wave in 2009 we had over 50,000.
pandemic was 1,800 and during the worst of the foreclosure wave in 2009 we had over 50,000.
S&P / Case-Shiller Home Price Index
Mar 25 - The latest S&P / Case-Shiller® Home Price Index® numbers were published this Tuesday.
The new report covers home sales during the period November 2024 to January 2025. This means
the typical home sale closed in mid December, more than 3 months ago. Please remember that CaseShiller data is fairly old, even on the day it is released.
The new report covers home sales during the period November 2024 to January 2025. This means
the typical home sale closed in mid December, more than 3 months ago. Please remember that CaseShiller data is fairly old, even on the day it is released.
9 cities show mildly rising prices but 11 cities went down over the month. The national average rose a
scant 0.06%. This was the first rise following five consecutive monthly declines for the national
average. Most of the percentage changes were very small, with Tampa the only one to change by
more than 0.55% since last month.
scant 0.06%. This was the first rise following five consecutive monthly declines for the national
average. Most of the percentage changes were very small, with Tampa the only one to change by
more than 0.55% since last month.
Comparing with the previous month's series we see the following changes:
1. Los Angeles +0.51%
2. Chicago +0.47%
3. Detroit +0.25%
4. Cleveland +0.24%
5. Phoenix +0.15%
6. San Diego +0.13%
7. Washington +0.09%
8. New York +0.09%
9. San Francisco +0.07%
10. Las Vegas -0.01%
11. Miami -0.08%
12. Seattle -0.10%
13. Denver -0.12%
14. Atlanta -0.16%
15. Minneapolis -0.22%
16. Charlotte -0.23%
17. Boston -0.28%
18. Portland -0.32%
19. Dallas -0.46%
20. Tampa -0.59%
Phoenix has fallen from 8th to 5th place over the last month. The national average rose +0.06% so
Phoenix was slightly better than this average.
Comparing year over year, we see the following changes:
1. New York +7.8%
2. Chicago +7.5%
3. Boston +6.6%
4. Cleveland +6.5%
5. Detroit +5.7%
6. Las Vegas +5.5%
7. Seattle +5.5%
8. Washington +5.1%
9. Los Angeles +4.0%
10. Minneapolis +3.6%
11. San Diego +3.4%
12. Miami +3.3%
13. Charlotte +3.3%
14. San Francisco +3.0%
15. Portland +2.8%
16. Phoenix +2.7%
17. Atlanta +2.4%
18. Denver +1.9%
19. Dallas +1.3%
20. Tampa -1.5%
Phoenix moved up one place from 17th to 16th, but is still stuck in the bottom half on a year over year
basis. For the third month we see just one city in negative territory - Tampa. Tampa's pricing has
fallen by 3.3% in total since June 2024.
basis. For the third month we see just one city in negative territory - Tampa. Tampa's pricing has
fallen by 3.3% in total since June 2024.
The national average is +4.1% year over year. Phoenix has under-performed over the last year
against that yardstick, but has moved closer to it since last month.
against that yardstick, but has moved closer to it since last month.